Data
83,909 items of data are available, covering 79,382 participants.
Defined-instances run from 2 to 3, labelled using Instancing
2.
Units of measurement are AU.
| Maximum | 0.00232877 |
| Decile 9 | 0.0012854 |
| Decile 8 | 0.00124713 |
| Decile 7 | 0.00122371 |
| Decile 6 | 0.00120572 |
| Median | 0.00119075 |
| Decile 4 | 0.00117668 |
| Decile 3 | 0.00116217 |
| Decile 2 | 0.00114597 |
| Decile 1 | 0.00112465 |
| Minimum | 0 |
|
|
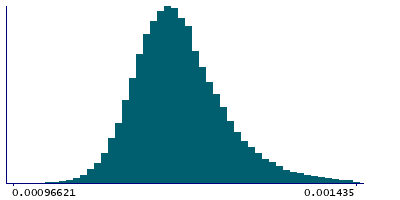
- Mean = 0.00120002
- Std.dev = 7.32328e-05
- 23 items below graph minimum of 0.000963901
- 632 items above graph maximum of 0.00144614
|
2 Instances
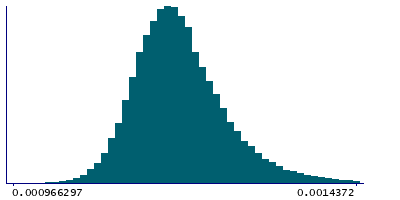
Instance 2 : Imaging visit (2014+)
79,151 participants, 79,151 items
| Maximum | 0.00232877 |
| Decile 9 | 0.00128695 |
| Decile 8 | 0.00124827 |
| Decile 7 | 0.00122488 |
| Decile 6 | 0.0012067 |
| Median | 0.00119175 |
| Decile 4 | 0.00117754 |
| Decile 3 | 0.00116307 |
| Decile 2 | 0.00114678 |
| Decile 1 | 0.00112549 |
| Minimum | 0 |
|
|
- Mean = 0.00120106
- Std.dev = 7.33397e-05
- 20 items below graph minimum of 0.00096403
- 599 items above graph maximum of 0.00144841
|
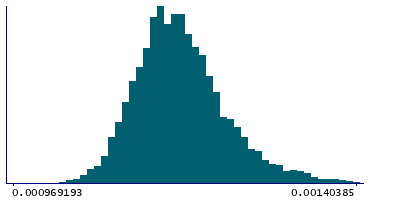
Instance 3 : First repeat imaging visit (2019+)
4,758 participants, 4,758 items
| Maximum | 0.00184252 |
| Decile 9 | 0.00125898 |
| Decile 8 | 0.00122449 |
| Decile 7 | 0.00120535 |
| Decile 6 | 0.0011893 |
| Median | 0.00117579 |
| Decile 4 | 0.00116235 |
| Decile 3 | 0.00114967 |
| Decile 2 | 0.00113469 |
| Decile 1 | 0.00111411 |
| Minimum | 0 |
|
|
- Mean = 0.00118258
- Std.dev = 6.91366e-05
- 3 items below graph minimum of 0.000969235
- 33 items above graph maximum of 0.00140385
|
Notes
Weighted-mean L1 in tract right parahippocampal part of cingulum (from dMRI data)
0 Related Data-Fields
There are no related data-fields
2 Applications
| Application ID | Title |
|---|
| 17689 | Genetic, environmental and lifestyle predictors of brain/cognitive-related outcomes. |
| 22783 | The joint analysis of imaging data and genetic data for early tumor detection, prevention, diagnosis and treatment |

