Data
83,909 items of data are available, covering 79,382 participants.
Defined-instances run from 2 to 3, labelled using Instancing
2.
Units of measurement are AU.
| Maximum | 0.00159049 |
| Decile 9 | 0.00135698 |
| Decile 8 | 0.00133452 |
| Decile 7 | 0.00131831 |
| Decile 6 | 0.00130418 |
| Median | 0.00129109 |
| Decile 4 | 0.0012779 |
| Decile 3 | 0.00126358 |
| Decile 2 | 0.00124611 |
| Decile 1 | 0.00122125 |
| Minimum | 0 |
|
|
- Mean = 0.00128964
- Std.dev = 5.81226e-05
- 59 items below graph minimum of 0.00108552
- 6 items above graph maximum of 0.00149271
|
2 Instances
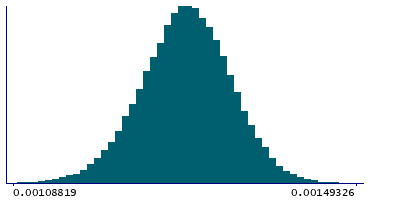
Instance 2 : Imaging visit (2014+)
79,151 participants, 79,151 items
| Maximum | 0.00159049 |
| Decile 9 | 0.00135712 |
| Decile 8 | 0.00133454 |
| Decile 7 | 0.00131827 |
| Decile 6 | 0.00130405 |
| Median | 0.00129088 |
| Decile 4 | 0.00127767 |
| Decile 3 | 0.00126328 |
| Decile 2 | 0.00124575 |
| Decile 1 | 0.00122089 |
| Minimum | 0 |
|

|
- Mean = 0.00128947
- Std.dev = 5.80474e-05
- 56 items below graph minimum of 0.00108467
- 6 items above graph maximum of 0.00149334
|
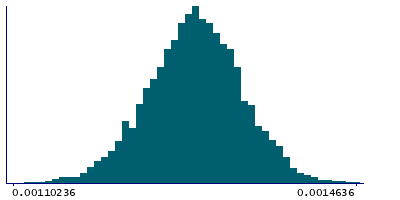
Instance 3 : First repeat imaging visit (2019+)
4,758 participants, 4,758 items
| Maximum | 0.0014636 |
| Decile 9 | 0.00135552 |
| Decile 8 | 0.00133401 |
| Decile 7 | 0.00131915 |
| Decile 6 | 0.00130604 |
| Median | 0.00129366 |
| Decile 4 | 0.00128208 |
| Decile 3 | 0.00126833 |
| Decile 2 | 0.00125247 |
| Decile 1 | 0.00122889 |
| Minimum | 0 |
|
|
- Mean = 0.00129238
- Std.dev = 5.92918e-05
- 4 items below graph minimum of 0.00110225
|
Notes
Weighted-mean L1 in tract left cingulate gyrus part of cingulum (from dMRI data)
0 Related Data-Fields
There are no related data-fields
2 Applications
| Application ID | Title |
|---|
| 17689 | Genetic, environmental and lifestyle predictors of brain/cognitive-related outcomes. |
| 22783 | The joint analysis of imaging data and genetic data for early tumor detection, prevention, diagnosis and treatment |

