Data
83,909 items of data are available, covering 79,382 participants.
Defined-instances run from 2 to 3, labelled using Instancing
2.
Units of measurement are AU.
| Maximum | 0.634588 |
| Decile 9 | 0.469122 |
| Decile 8 | 0.444669 |
| Decile 7 | 0.426506 |
| Decile 6 | 0.410528 |
| Median | 0.395402 |
| Decile 4 | 0.37997 |
| Decile 3 | 0.363205 |
| Decile 2 | 0.343492 |
| Decile 1 | 0.31556 |
| Minimum | -0.05313 |
|

|
- Mean = 0.393629
- Std.dev = 0.0598783
- 15 items below graph minimum of 0.161998
- 2 items above graph maximum of 0.622685
|
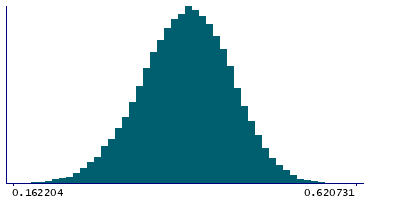
2 Instances
Instance 2 : Imaging visit (2014+)
79,151 participants, 79,151 items
| Maximum | 0.634588 |
| Decile 9 | 0.469329 |
| Decile 8 | 0.444931 |
| Decile 7 | 0.426795 |
| Decile 6 | 0.410867 |
| Median | 0.395737 |
| Decile 4 | 0.380276 |
| Decile 3 | 0.363561 |
| Decile 2 | 0.343785 |
| Decile 1 | 0.315838 |
| Minimum | -0.00643977 |
|
|
- Mean = 0.393895
- Std.dev = 0.0598815
- 14 items below graph minimum of 0.162347
- 2 items above graph maximum of 0.62282
|
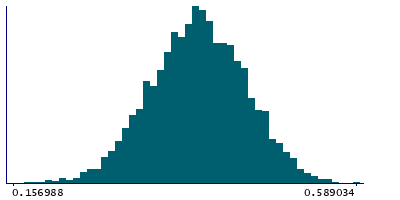
Instance 3 : First repeat imaging visit (2019+)
4,758 participants, 4,758 items
| Maximum | 0.589034 |
| Decile 9 | 0.466294 |
| Decile 8 | 0.440638 |
| Decile 7 | 0.42189 |
| Decile 6 | 0.404242 |
| Median | 0.389942 |
| Decile 4 | 0.375191 |
| Decile 3 | 0.358481 |
| Decile 2 | 0.339293 |
| Decile 1 | 0.311589 |
| Minimum | -0.05313 |
|
|
- Mean = 0.389202
- Std.dev = 0.0596518
- 1 item below graph minimum of 0.156885
|
Notes
Weighted-mean MO (diffusion tensor mode) in tract left superior thalamic radiation (from dMRI data)
0 Related Data-Fields
There are no related data-fields
2 Applications
| Application ID | Title |
|---|
| 17689 | Genetic, environmental and lifestyle predictors of brain/cognitive-related outcomes. |
| 22783 | The joint analysis of imaging data and genetic data for early tumor detection, prevention, diagnosis and treatment |

