Data
83,909 items of data are available, covering 79,382 participants.
Defined-instances run from 2 to 3, labelled using Instancing
2.
Units of measurement are AU.
| Maximum | 0.652587 |
| Decile 9 | 0.538871 |
| Decile 8 | 0.520069 |
| Decile 7 | 0.506098 |
| Decile 6 | 0.493887 |
| Median | 0.48225 |
| Decile 4 | 0.47063 |
| Decile 3 | 0.457488 |
| Decile 2 | 0.441478 |
| Decile 1 | 0.418381 |
| Minimum | 0 |
|

|
- Mean = 0.479892
- Std.dev = 0.0482811
- 114 items below graph minimum of 0.297892
|
2 Instances
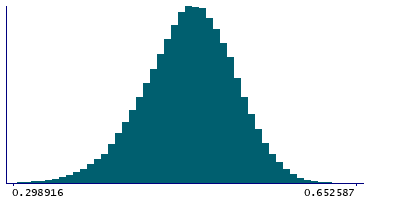
Instance 2 : Imaging visit (2014+)
79,151 participants, 79,151 items
| Maximum | 0.652587 |
| Decile 9 | 0.539103 |
| Decile 8 | 0.520324 |
| Decile 7 | 0.506307 |
| Decile 6 | 0.494079 |
| Median | 0.48246 |
| Decile 4 | 0.47075 |
| Decile 3 | 0.457556 |
| Decile 2 | 0.441447 |
| Decile 1 | 0.418233 |
| Minimum | 0 |
|
|
- Mean = 0.479991
- Std.dev = 0.0483902
- 106 items below graph minimum of 0.297363
|
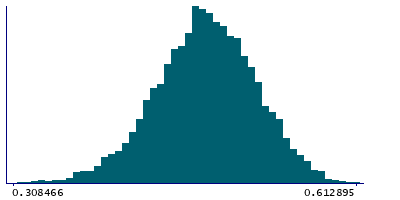
Instance 3 : First repeat imaging visit (2019+)
4,758 participants, 4,758 items
| Maximum | 0.612895 |
| Decile 9 | 0.535136 |
| Decile 8 | 0.516462 |
| Decile 7 | 0.502791 |
| Decile 6 | 0.490597 |
| Median | 0.479431 |
| Decile 4 | 0.469054 |
| Decile 3 | 0.456774 |
| Decile 2 | 0.442361 |
| Decile 1 | 0.421799 |
| Minimum | 0 |
|
|
- Mean = 0.478245
- Std.dev = 0.0463989
- 8 items below graph minimum of 0.308461
|
Notes
Weighted-mean MO (diffusion tensor mode) in tract right posterior thalamic radiation (from dMRI data)
0 Related Data-Fields
There are no related data-fields
2 Applications
| Application ID | Title |
|---|
| 17689 | Genetic, environmental and lifestyle predictors of brain/cognitive-related outcomes. |
| 22783 | The joint analysis of imaging data and genetic data for early tumor detection, prevention, diagnosis and treatment |

