Data
83,909 items of data are available, covering 79,382 participants.
Defined-instances run from 2 to 3, labelled using Instancing
2.
Units of measurement are AU.
| Maximum | 0.841046 |
| Decile 9 | 0.597583 |
| Decile 8 | 0.567914 |
| Decile 7 | 0.545314 |
| Decile 6 | 0.52428 |
| Median | 0.503995 |
| Decile 4 | 0.483408 |
| Decile 3 | 0.460898 |
| Decile 2 | 0.436422 |
| Decile 1 | 0.403525 |
| Minimum | -0.169366 |
|
|
- Mean = 0.50158
- Std.dev = 0.0761084
- 88 items below graph minimum of 0.209467
- 2 items above graph maximum of 0.791641
|
2 Instances
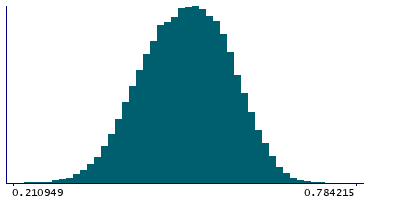
Instance 2 : Imaging visit (2014+)
79,151 participants, 79,151 items
| Maximum | 0.841046 |
| Decile 9 | 0.59797 |
| Decile 8 | 0.568335 |
| Decile 7 | 0.54575 |
| Decile 6 | 0.524718 |
| Median | 0.504373 |
| Decile 4 | 0.483731 |
| Decile 3 | 0.461103 |
| Decile 2 | 0.436824 |
| Decile 1 | 0.403727 |
| Minimum | -0.169366 |
|

|
- Mean = 0.501937
- Std.dev = 0.0761447
- 84 items below graph minimum of 0.209485
- 2 items above graph maximum of 0.792212
|
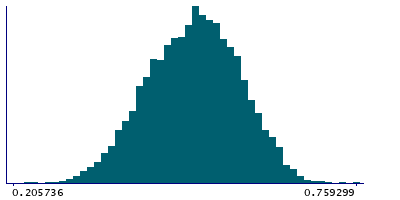
Instance 3 : First repeat imaging visit (2019+)
4,758 participants, 4,758 items
| Maximum | 0.759299 |
| Decile 9 | 0.590343 |
| Decile 8 | 0.561211 |
| Decile 7 | 0.53743 |
| Decile 6 | 0.517557 |
| Median | 0.49891 |
| Decile 4 | 0.478374 |
| Decile 3 | 0.455541 |
| Decile 2 | 0.430595 |
| Decile 1 | 0.398071 |
| Minimum | 0 |
|
|
- Mean = 0.49565
- Std.dev = 0.0752547
- 4 items below graph minimum of 0.205799
|
Notes
Weighted-mean MO (diffusion tensor mode) in tract middle cerebellar peduncle (from dMRI data)
0 Related Data-Fields
There are no related data-fields
2 Applications
| Application ID | Title |
|---|
| 17689 | Genetic, environmental and lifestyle predictors of brain/cognitive-related outcomes. |
| 22783 | The joint analysis of imaging data and genetic data for early tumor detection, prevention, diagnosis and treatment |

