Data
83,909 items of data are available, covering 79,382 participants.
Defined-instances run from 2 to 3, labelled using Instancing
2.
Units of measurement are AU.
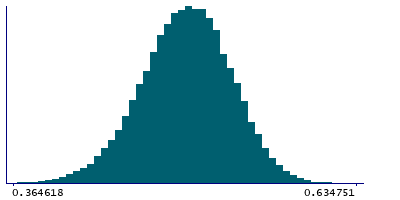
| Maximum | 0.640642 |
| Decile 9 | 0.543839 |
| Decile 8 | 0.529159 |
| Decile 7 | 0.51854 |
| Decile 6 | 0.509262 |
| Median | 0.50022 |
| Decile 4 | 0.491091 |
| Decile 3 | 0.481351 |
| Decile 2 | 0.469724 |
| Decile 1 | 0.453057 |
| Minimum | 0 |
|
|
- Mean = 0.498966
- Std.dev = 0.0364991
- 79 items below graph minimum of 0.362275
- 1 item above graph maximum of 0.63462
|
2 Instances
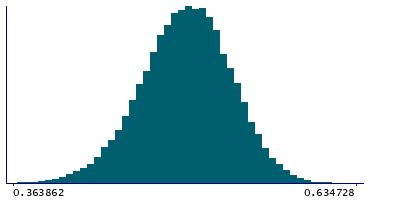
Instance 2 : Imaging visit (2014+)
79,151 participants, 79,151 items
| Maximum | 0.640642 |
| Decile 9 | 0.543557 |
| Decile 8 | 0.528861 |
| Decile 7 | 0.518221 |
| Decile 6 | 0.508955 |
| Median | 0.499917 |
| Decile 4 | 0.49073 |
| Decile 3 | 0.480959 |
| Decile 2 | 0.469315 |
| Decile 1 | 0.452634 |
| Minimum | 0 |
|
|
- Mean = 0.498616
- Std.dev = 0.036589
- 77 items below graph minimum of 0.361712
- 1 item above graph maximum of 0.63448
|
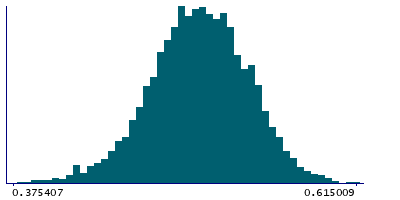
Instance 3 : First repeat imaging visit (2019+)
4,758 participants, 4,758 items
| Maximum | 0.615009 |
| Decile 9 | 0.547627 |
| Decile 8 | 0.533923 |
| Decile 7 | 0.523558 |
| Decile 6 | 0.514454 |
| Median | 0.50573 |
| Decile 4 | 0.496828 |
| Decile 3 | 0.487991 |
| Decile 2 | 0.477243 |
| Decile 1 | 0.461529 |
| Minimum | 0.22938 |
|
|
- Mean = 0.504792
- Std.dev = 0.0344515
- 3 items below graph minimum of 0.375431
|
Notes
Weighted-mean MO (diffusion tensor mode) in tract left inferior longitudinal fasciculus (from dMRI data)
0 Related Data-Fields
There are no related data-fields
2 Applications
| Application ID | Title |
|---|
| 17689 | Genetic, environmental and lifestyle predictors of brain/cognitive-related outcomes. |
| 22783 | The joint analysis of imaging data and genetic data for early tumor detection, prevention, diagnosis and treatment |

