Data
83,909 items of data are available, covering 79,382 participants.
Defined-instances run from 2 to 3, labelled using Instancing
2.
Units of measurement are AU.
| Maximum | 0.628228 |
| Decile 9 | 0.538045 |
| Decile 8 | 0.521778 |
| Decile 7 | 0.509712 |
| Decile 6 | 0.499416 |
| Median | 0.489747 |
| Decile 4 | 0.479889 |
| Decile 3 | 0.469287 |
| Decile 2 | 0.456703 |
| Decile 1 | 0.439151 |
| Minimum | 0 |
|
|
- Mean = 0.488843
- Std.dev = 0.0392171
- 67 items below graph minimum of 0.340257
|
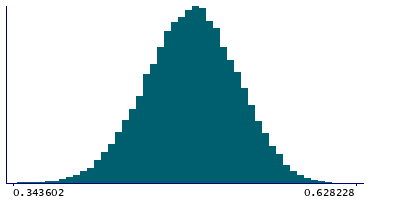
2 Instances
Instance 2 : Imaging visit (2014+)
79,151 participants, 79,151 items
| Maximum | 0.628228 |
| Decile 9 | 0.537952 |
| Decile 8 | 0.521704 |
| Decile 7 | 0.509677 |
| Decile 6 | 0.499367 |
| Median | 0.489703 |
| Decile 4 | 0.47985 |
| Decile 3 | 0.469188 |
| Decile 2 | 0.456596 |
| Decile 1 | 0.438996 |
| Minimum | 0 |
|

|
- Mean = 0.488759
- Std.dev = 0.0392603
- 62 items below graph minimum of 0.340039
|
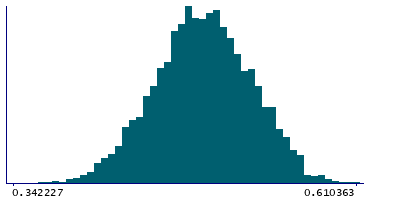
Instance 3 : First repeat imaging visit (2019+)
4,758 participants, 4,758 items
| Maximum | 0.610363 |
| Decile 9 | 0.539735 |
| Decile 8 | 0.523389 |
| Decile 7 | 0.510451 |
| Decile 6 | 0.500256 |
| Median | 0.490821 |
| Decile 4 | 0.480792 |
| Decile 3 | 0.470978 |
| Decile 2 | 0.458571 |
| Decile 1 | 0.440954 |
| Minimum | 0 |
|
|
- Mean = 0.490232
- Std.dev = 0.0384646
- 5 items below graph minimum of 0.342174
|
Notes
Weighted-mean MO (diffusion tensor mode) in tract forceps minor (from dMRI data)
0 Related Data-Fields
There are no related data-fields
2 Applications
| Application ID | Title |
|---|
| 17689 | Genetic, environmental and lifestyle predictors of brain/cognitive-related outcomes. |
| 22783 | The joint analysis of imaging data and genetic data for early tumor detection, prevention, diagnosis and treatment |

