Data
83,909 items of data are available, covering 79,382 participants.
Defined-instances run from 2 to 3, labelled using Instancing
2.
Units of measurement are AU.
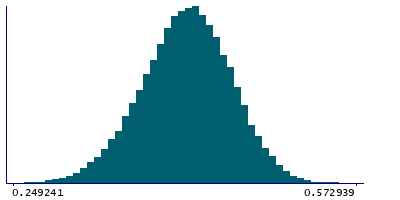
| Maximum | 0.595237 |
| Decile 9 | 0.469124 |
| Decile 8 | 0.451586 |
| Decile 7 | 0.438437 |
| Decile 6 | 0.427019 |
| Median | 0.416382 |
| Decile 4 | 0.405384 |
| Decile 3 | 0.393677 |
| Decile 2 | 0.379475 |
| Decile 1 | 0.359348 |
| Minimum | 0 |
|
|
- Mean = 0.415055
- Std.dev = 0.0435794
- 39 items below graph minimum of 0.249572
- 5 items above graph maximum of 0.5789
|
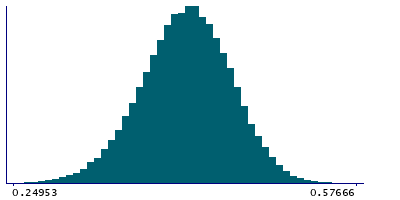
2 Instances
Instance 2 : Imaging visit (2014+)
79,151 participants, 79,151 items
| Maximum | 0.595237 |
| Decile 9 | 0.469383 |
| Decile 8 | 0.451864 |
| Decile 7 | 0.438641 |
| Decile 6 | 0.427218 |
| Median | 0.416564 |
| Decile 4 | 0.405513 |
| Decile 3 | 0.393804 |
| Decile 2 | 0.379631 |
| Decile 1 | 0.359517 |
| Minimum | 0 |
|
|
- Mean = 0.415255
- Std.dev = 0.0435879
- 36 items below graph minimum of 0.24965
- 4 items above graph maximum of 0.579249
|
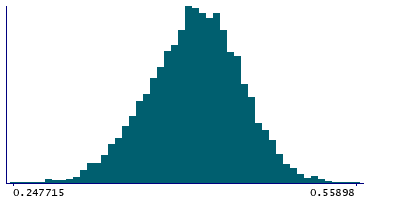
Instance 3 : First repeat imaging visit (2019+)
4,758 participants, 4,758 items
| Maximum | 0.55898 |
| Decile 9 | 0.464124 |
| Decile 8 | 0.447598 |
| Decile 7 | 0.434982 |
| Decile 6 | 0.424329 |
| Median | 0.413577 |
| Decile 4 | 0.403424 |
| Decile 3 | 0.391291 |
| Decile 2 | 0.376378 |
| Decile 1 | 0.355902 |
| Minimum | 0 |
|
|
- Mean = 0.411727
- Std.dev = 0.0433022
- 3 items below graph minimum of 0.247679
|
Notes
Weighted-mean MO (diffusion tensor mode) in tract right anterior thalamic radiation (from dMRI data)
0 Related Data-Fields
There are no related data-fields
2 Applications
| Application ID | Title |
|---|
| 17689 | Genetic, environmental and lifestyle predictors of brain/cognitive-related outcomes. |
| 22783 | The joint analysis of imaging data and genetic data for early tumor detection, prevention, diagnosis and treatment |

