Data
83,909 items of data are available, covering 79,382 participants.
Defined-instances run from 2 to 3, labelled using Instancing
2.
Units of measurement are AU.
| Maximum | 0.00228416 |
| Decile 9 | 0.000836822 |
| Decile 8 | 0.000805746 |
| Decile 7 | 0.000784271 |
| Decile 6 | 0.000766001 |
| Median | 0.000748315 |
| Decile 4 | 0.00073091 |
| Decile 3 | 0.0007141 |
| Decile 2 | 0.000697178 |
| Decile 1 | 0.000677778 |
| Minimum | 0 |
|
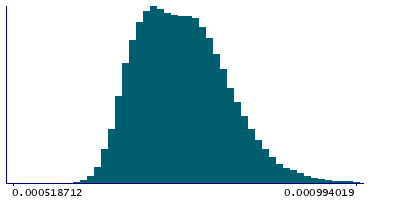
|
- Mean = 0.000753638
- Std.dev = 6.66443e-05
- 50 items below graph minimum of 0.000518733
- 183 items above graph maximum of 0.000995866
|
2 Instances
Instance 2 : Imaging visit (2014+)
79,151 participants, 79,151 items
| Maximum | 0.00228416 |
| Decile 9 | 0.000837555 |
| Decile 8 | 0.000806498 |
| Decile 7 | 0.000785028 |
| Decile 6 | 0.000766755 |
| Median | 0.000749184 |
| Decile 4 | 0.000731647 |
| Decile 3 | 0.000714927 |
| Decile 2 | 0.000697912 |
| Decile 1 | 0.000678535 |
| Minimum | 0 |
|
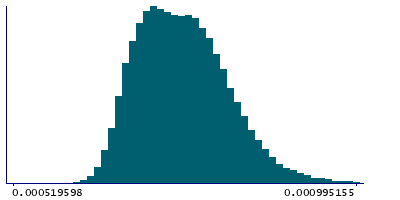
|
- Mean = 0.000754447
- Std.dev = 6.67501e-05
- 47 items below graph minimum of 0.000519515
- 177 items above graph maximum of 0.000996575
|
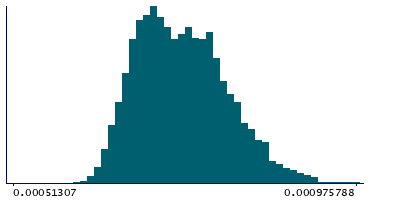
Instance 3 : First repeat imaging visit (2019+)
4,758 participants, 4,758 items
| Maximum | 0.00101452 |
| Decile 9 | 0.000821552 |
| Decile 8 | 0.000791356 |
| Decile 7 | 0.00077185 |
| Decile 6 | 0.00075319 |
| Median | 0.00073514 |
| Decile 4 | 0.000717234 |
| Decile 3 | 0.000701613 |
| Decile 2 | 0.000685351 |
| Decile 1 | 0.000667331 |
| Minimum | 0 |
|
|
- Mean = 0.000740184
- Std.dev = 6.33613e-05
- 3 items below graph minimum of 0.00051311
- 5 items above graph maximum of 0.000975772
|
Notes
Weighted-mean MD (mean diffusivity) in tract middle cerebellar peduncle (from dMRI data)
0 Related Data-Fields
There are no related data-fields
2 Applications
| Application ID | Title |
|---|
| 17689 | Genetic, environmental and lifestyle predictors of brain/cognitive-related outcomes. |
| 22783 | The joint analysis of imaging data and genetic data for early tumor detection, prevention, diagnosis and treatment |

