Data
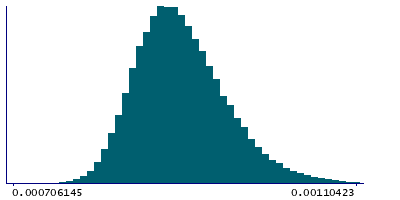
83,909 items of data are available, covering 79,382 participants.
Defined-instances run from 2 to 3, labelled using Instancing
2.
Units of measurement are AU.
| Maximum | 0.00140082 |
| Decile 9 | 0.000973484 |
| Decile 8 | 0.000944482 |
| Decile 7 | 0.000925702 |
| Decile 6 | 0.000910431 |
| Median | 0.000897109 |
| Decile 4 | 0.000884483 |
| Decile 3 | 0.000871844 |
| Decile 2 | 0.000857701 |
| Decile 1 | 0.000839791 |
| Minimum | 0 |
|

|
- Mean = 0.000902736
- Std.dev = 5.5668e-05
- 19 items below graph minimum of 0.000706097
- 200 items above graph maximum of 0.00110718
|
2 Instances
Instance 2 : Imaging visit (2014+)
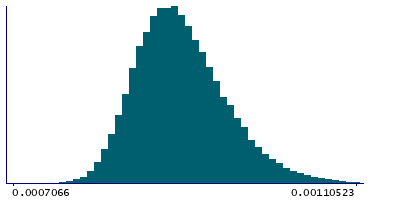
79,151 participants, 79,151 items
| Maximum | 0.00140082 |
| Decile 9 | 0.000974078 |
| Decile 8 | 0.000945161 |
| Decile 7 | 0.000926285 |
| Decile 6 | 0.000910997 |
| Median | 0.000897695 |
| Decile 4 | 0.00088509 |
| Decile 3 | 0.000872398 |
| Decile 2 | 0.000858213 |
| Decile 1 | 0.000840351 |
| Minimum | 0 |
|

|
- Mean = 0.000903349
- Std.dev = 5.5748e-05
- 18 items below graph minimum of 0.000706624
- 194 items above graph maximum of 0.0011078
|
Instance 3 : First repeat imaging visit (2019+)
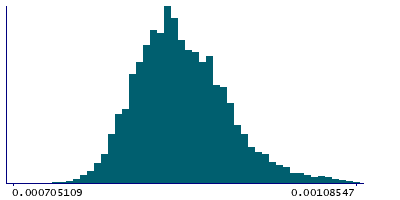
4,758 participants, 4,758 items
| Maximum | 0.00118036 |
| Decile 9 | 0.000958705 |
| Decile 8 | 0.00093355 |
| Decile 7 | 0.000916009 |
| Decile 6 | 0.000900593 |
| Median | 0.000886685 |
| Decile 4 | 0.000875506 |
| Decile 3 | 0.000862841 |
| Decile 2 | 0.000848908 |
| Decile 1 | 0.000831886 |
| Minimum | 0 |
|

|
- Mean = 0.00089254
- Std.dev = 5.32954e-05
- 1 item below graph minimum of 0.000705067
- 7 items above graph maximum of 0.00108552
|
Notes
Weighted-mean MD (mean diffusivity) in tract forceps major (from dMRI data)
0 Related Data-Fields
There are no related data-fields
2 Applications
| Application ID | Title |
|---|
| 17689 | Genetic, environmental and lifestyle predictors of brain/cognitive-related outcomes. |
| 22783 | The joint analysis of imaging data and genetic data for early tumor detection, prevention, diagnosis and treatment |


