Data
83,909 items of data are available, covering 79,382 participants.
Defined-instances run from 2 to 3, labelled using Instancing
2.
Units of measurement are AU.
| Maximum | 0.00152684 |
| Decile 9 | 0.000802415 |
| Decile 8 | 0.000789397 |
| Decile 7 | 0.000780593 |
| Decile 6 | 0.00077335 |
| Median | 0.000766653 |
| Decile 4 | 0.000760265 |
| Decile 3 | 0.000753638 |
| Decile 2 | 0.000745844 |
| Decile 1 | 0.000735016 |
| Minimum | 0 |
|

|
- Mean = 0.000767628
- Std.dev = 3.05425e-05
- 77 items below graph minimum of 0.000667617
- 77 items above graph maximum of 0.000869815
|
2 Instances
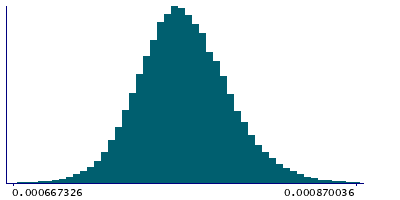
Instance 2 : Imaging visit (2014+)
79,151 participants, 79,151 items
| Maximum | 0.00152684 |
| Decile 9 | 0.000802541 |
| Decile 8 | 0.000789501 |
| Decile 7 | 0.00078066 |
| Decile 6 | 0.000773365 |
| Median | 0.000766659 |
| Decile 4 | 0.00076028 |
| Decile 3 | 0.000753588 |
| Decile 2 | 0.000745685 |
| Decile 1 | 0.000734787 |
| Minimum | 0 |
|
|
- Mean = 0.000767625
- Std.dev = 3.05176e-05
- 72 items below graph minimum of 0.000667033
- 74 items above graph maximum of 0.000870295
|
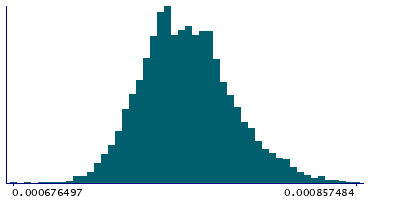
Instance 3 : First repeat imaging visit (2019+)
4,758 participants, 4,758 items
| Maximum | 0.000857484 |
| Decile 9 | 0.000800281 |
| Decile 8 | 0.000787332 |
| Decile 7 | 0.000779618 |
| Decile 6 | 0.000773095 |
| Median | 0.000766606 |
| Decile 4 | 0.000760064 |
| Decile 3 | 0.000754416 |
| Decile 2 | 0.000747993 |
| Decile 1 | 0.000738374 |
| Minimum | 0 |
|
|
- Mean = 0.000767665
- Std.dev = 3.0953e-05
- 3 items below graph minimum of 0.000676468
|
Notes
Weighted-mean MD (mean diffusivity) in tract right cingulate gyrus part of cingulum (from dMRI data)
0 Related Data-Fields
There are no related data-fields
2 Applications
| Application ID | Title |
|---|
| 17689 | Genetic, environmental and lifestyle predictors of brain/cognitive-related outcomes. |
| 22783 | The joint analysis of imaging data and genetic data for early tumor detection, prevention, diagnosis and treatment |

