Data
83,909 items of data are available, covering 79,382 participants.
Defined-instances run from 2 to 3, labelled using Instancing
2.
Units of measurement are AU.
| Maximum | 0.00112196 |
| Decile 9 | 0.000801469 |
| Decile 8 | 0.000788253 |
| Decile 7 | 0.000779109 |
| Decile 6 | 0.000771635 |
| Median | 0.000764898 |
| Decile 4 | 0.000758385 |
| Decile 3 | 0.000751603 |
| Decile 2 | 0.000743592 |
| Decile 1 | 0.000732612 |
| Minimum | 0 |
|
|
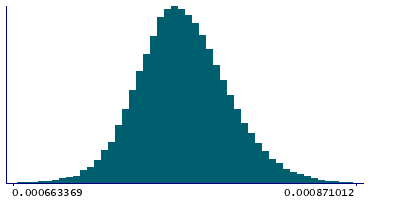
- Mean = 0.000765928
- Std.dev = 3.08143e-05
- 70 items below graph minimum of 0.000663755
- 73 items above graph maximum of 0.000870327
|
2 Instances
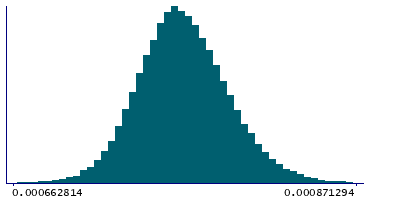
Instance 2 : Imaging visit (2014+)
79,151 participants, 79,151 items
| Maximum | 0.00112196 |
| Decile 9 | 0.000801612 |
| Decile 8 | 0.000788328 |
| Decile 7 | 0.00077915 |
| Decile 6 | 0.000771646 |
| Median | 0.000764867 |
| Decile 4 | 0.000758339 |
| Decile 3 | 0.000751539 |
| Decile 2 | 0.000743418 |
| Decile 1 | 0.000732394 |
| Minimum | 0 |
|
|
- Mean = 0.000765903
- Std.dev = 3.07774e-05
- 67 items below graph minimum of 0.000663176
- 69 items above graph maximum of 0.00087083
|
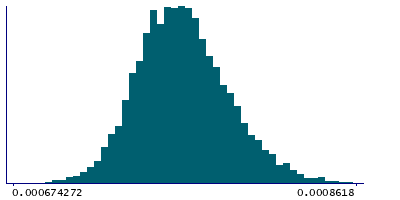
Instance 3 : First repeat imaging visit (2019+)
4,758 participants, 4,758 items
| Maximum | 0.000868877 |
| Decile 9 | 0.000799303 |
| Decile 8 | 0.000787111 |
| Decile 7 | 0.000778303 |
| Decile 6 | 0.000771481 |
| Median | 0.000765293 |
| Decile 4 | 0.000759211 |
| Decile 3 | 0.000752641 |
| Decile 2 | 0.000746118 |
| Decile 1 | 0.000736802 |
| Minimum | 0 |
|
|
- Mean = 0.000766339
- Std.dev = 3.1418e-05
- 4 items below graph minimum of 0.000674301
- 1 item above graph maximum of 0.000861804
|
Notes
Weighted-mean MD (mean diffusivity) in tract left cingulate gyrus part of cingulum (from dMRI data)
0 Related Data-Fields
There are no related data-fields
2 Applications
| Application ID | Title |
|---|
| 17689 | Genetic, environmental and lifestyle predictors of brain/cognitive-related outcomes. |
| 22783 | The joint analysis of imaging data and genetic data for early tumor detection, prevention, diagnosis and treatment |

