Data
83,909 items of data are available, covering 79,382 participants.
Defined-instances run from 2 to 3, labelled using Instancing
2.
Units of measurement are AU.
| Maximum | 0.00151354 |
| Decile 9 | 0.000825893 |
| Decile 8 | 0.000807014 |
| Decile 7 | 0.000794529 |
| Decile 6 | 0.000784541 |
| Median | 0.000775688 |
| Decile 4 | 0.000767045 |
| Decile 3 | 0.000757937 |
| Decile 2 | 0.000747941 |
| Decile 1 | 0.000734451 |
| Minimum | 0 |
|

|
- Mean = 0.000778164
- Std.dev = 3.95155e-05
- 30 items below graph minimum of 0.000643009
- 162 items above graph maximum of 0.000917335
|
2 Instances
Instance 2 : Imaging visit (2014+)
79,151 participants, 79,151 items
| Maximum | 0.00151354 |
| Decile 9 | 0.000826231 |
| Decile 8 | 0.000807349 |
| Decile 7 | 0.000794816 |
| Decile 6 | 0.000784777 |
| Median | 0.000775871 |
| Decile 4 | 0.00076726 |
| Decile 3 | 0.000758117 |
| Decile 2 | 0.000748085 |
| Decile 1 | 0.000734554 |
| Minimum | 0 |
|

|
- Mean = 0.00077842
- Std.dev = 3.95022e-05
- 27 items below graph minimum of 0.000642878
- 160 items above graph maximum of 0.000917908
|
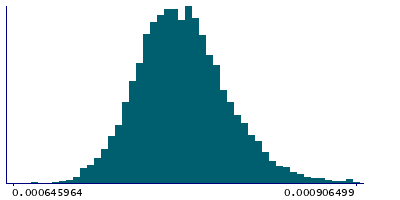
Instance 3 : First repeat imaging visit (2019+)
4,758 participants, 4,758 items
| Maximum | 0.000911615 |
| Decile 9 | 0.000819654 |
| Decile 8 | 0.00080143 |
| Decile 7 | 0.000789903 |
| Decile 6 | 0.000780827 |
| Median | 0.000772258 |
| Decile 4 | 0.000763713 |
| Decile 3 | 0.000755228 |
| Decile 2 | 0.000745933 |
| Decile 1 | 0.000732801 |
| Minimum | 0 |
|
|
- Mean = 0.000773907
- Std.dev = 3.94931e-05
- 3 items below graph minimum of 0.000645948
- 2 items above graph maximum of 0.000906508
|
Notes
Weighted-mean MD (mean diffusivity) in tract left acoustic radiation (from dMRI data)
0 Related Data-Fields
There are no related data-fields
2 Applications
| Application ID | Title |
|---|
| 17689 | Genetic, environmental and lifestyle predictors of brain/cognitive-related outcomes. |
| 22783 | The joint analysis of imaging data and genetic data for early tumor detection, prevention, diagnosis and treatment |

