Data
83,909 items of data are available, covering 79,382 participants.
Defined-instances run from 2 to 3, labelled using Instancing
2.
Units of measurement are AU.
| Maximum | 0.595286 |
| Decile 9 | 0.458276 |
| Decile 8 | 0.447195 |
| Decile 7 | 0.439455 |
| Decile 6 | 0.432726 |
| Median | 0.426465 |
| Decile 4 | 0.420283 |
| Decile 3 | 0.413736 |
| Decile 2 | 0.406 |
| Decile 1 | 0.395183 |
| Minimum | 0 |
|
|
- Mean = 0.426571
- Std.dev = 0.0256743
- 60 items below graph minimum of 0.33209
- 50 items above graph maximum of 0.521369
|
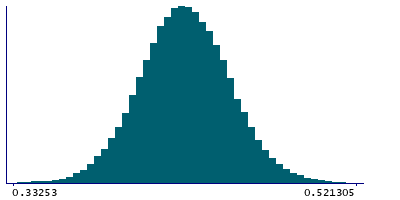
2 Instances
Instance 2 : Imaging visit (2014+)
79,151 participants, 79,151 items
| Maximum | 0.595286 |
| Decile 9 | 0.458111 |
| Decile 8 | 0.446983 |
| Decile 7 | 0.439212 |
| Decile 6 | 0.432454 |
| Median | 0.426231 |
| Decile 4 | 0.42004 |
| Decile 3 | 0.413501 |
| Decile 2 | 0.405718 |
| Decile 1 | 0.394915 |
| Minimum | 0 |
|

|
- Mean = 0.426323
- Std.dev = 0.0256712
- 53 items below graph minimum of 0.331719
- 48 items above graph maximum of 0.521307
|
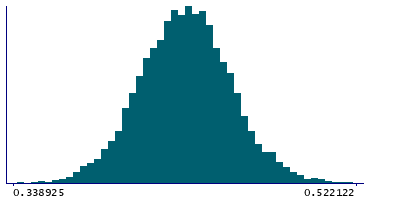
Instance 3 : First repeat imaging visit (2019+)
4,758 participants, 4,758 items
| Maximum | 0.575698 |
| Decile 9 | 0.461065 |
| Decile 8 | 0.450795 |
| Decile 7 | 0.443245 |
| Decile 6 | 0.437011 |
| Median | 0.430872 |
| Decile 4 | 0.424655 |
| Decile 3 | 0.41817 |
| Decile 2 | 0.410275 |
| Decile 1 | 0.399989 |
| Minimum | 0 |
|
|
- Mean = 0.430698
- Std.dev = 0.0253728
- 6 items below graph minimum of 0.338913
- 2 items above graph maximum of 0.522141
|
Notes
Weighted-mean FA (fractional anisotropy) in tract right medial lemniscus (from dMRI data)
0 Related Data-Fields
There are no related data-fields
2 Applications
| Application ID | Title |
|---|
| 17689 | Genetic, environmental and lifestyle predictors of brain/cognitive-related outcomes. |
| 22783 | The joint analysis of imaging data and genetic data for early tumor detection, prevention, diagnosis and treatment |

