Data
83,909 items of data are available, covering 79,382 participants.
Defined-instances run from 2 to 3, labelled using Instancing
2.
Units of measurement are AU.
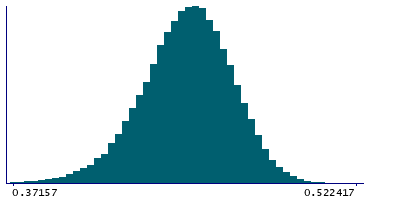
| Maximum | 0.549601 |
| Decile 9 | 0.471384 |
| Decile 8 | 0.463476 |
| Decile 7 | 0.457663 |
| Decile 6 | 0.452584 |
| Median | 0.447668 |
| Decile 4 | 0.442635 |
| Decile 3 | 0.437114 |
| Decile 2 | 0.430351 |
| Decile 1 | 0.420419 |
| Minimum | 0 |
|
|
- Mean = 0.446419
- Std.dev = 0.0211173
- 184 items below graph minimum of 0.369455
- 2 items above graph maximum of 0.522348
|
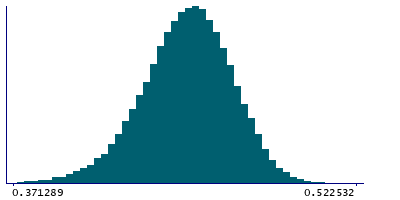
2 Instances
Instance 2 : Imaging visit (2014+)
79,151 participants, 79,151 items
| Maximum | 0.549601 |
| Decile 9 | 0.471305 |
| Decile 8 | 0.463416 |
| Decile 7 | 0.457572 |
| Decile 6 | 0.452487 |
| Median | 0.447552 |
| Decile 4 | 0.442491 |
| Decile 3 | 0.436968 |
| Decile 2 | 0.430183 |
| Decile 1 | 0.42021 |
| Minimum | 0 |
|
|
- Mean = 0.446288
- Std.dev = 0.0211621
- 179 items below graph minimum of 0.369115
- 2 items above graph maximum of 0.5224
|
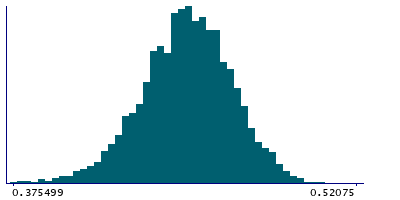
Instance 3 : First repeat imaging visit (2019+)
4,758 participants, 4,758 items
| Maximum | 0.52109 |
| Decile 9 | 0.472339 |
| Decile 8 | 0.464749 |
| Decile 7 | 0.459223 |
| Decile 6 | 0.454255 |
| Median | 0.449399 |
| Decile 4 | 0.444839 |
| Decile 3 | 0.4393 |
| Decile 2 | 0.433531 |
| Decile 1 | 0.423899 |
| Minimum | 0 |
|
|
- Mean = 0.448595
- Std.dev = 0.0202348
- 4 items below graph minimum of 0.375459
- 1 item above graph maximum of 0.520779
|
Notes
Weighted-mean FA (fractional anisotropy) in tract right inferior longitudinal fasciculus (from dMRI data)
0 Related Data-Fields
There are no related data-fields
2 Applications
| Application ID | Title |
|---|
| 17689 | Genetic, environmental and lifestyle predictors of brain/cognitive-related outcomes. |
| 22783 | The joint analysis of imaging data and genetic data for early tumor detection, prevention, diagnosis and treatment |

