Data
83,909 items of data are available, covering 79,382 participants.
Defined-instances run from 2 to 3, labelled using Instancing
2.
Units of measurement are AU.
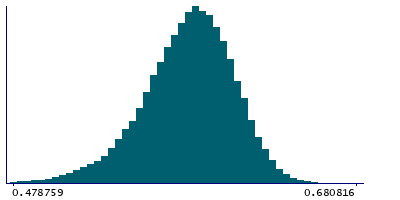
| Maximum | 0.681893 |
| Decile 9 | 0.613072 |
| Decile 8 | 0.603374 |
| Decile 7 | 0.595985 |
| Decile 6 | 0.589342 |
| Median | 0.583093 |
| Decile 4 | 0.576403 |
| Decile 3 | 0.568853 |
| Decile 2 | 0.559453 |
| Decile 1 | 0.544981 |
| Minimum | 0 |
|
|
- Mean = 0.580301
- Std.dev = 0.0292883
- 291 items below graph minimum of 0.47689
- 1 item above graph maximum of 0.681163
|
2 Instances
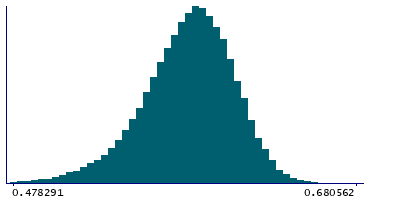
Instance 2 : Imaging visit (2014+)
79,151 participants, 79,151 items
| Maximum | 0.681893 |
| Decile 9 | 0.612931 |
| Decile 8 | 0.603232 |
| Decile 7 | 0.595851 |
| Decile 6 | 0.589216 |
| Median | 0.582957 |
| Decile 4 | 0.576271 |
| Decile 3 | 0.56868 |
| Decile 2 | 0.55929 |
| Decile 1 | 0.544715 |
| Minimum | 0 |
|
|
- Mean = 0.580133
- Std.dev = 0.0293336
- 282 items below graph minimum of 0.4765
- 1 item above graph maximum of 0.681147
|
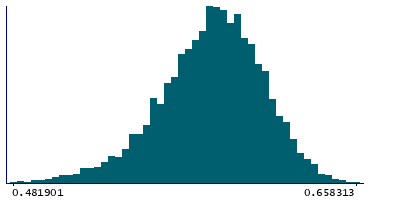
Instance 3 : First repeat imaging visit (2019+)
4,758 participants, 4,758 items
| Maximum | 0.658313 |
| Decile 9 | 0.615416 |
| Decile 8 | 0.60547 |
| Decile 7 | 0.598181 |
| Decile 6 | 0.591546 |
| Median | 0.585283 |
| Decile 4 | 0.579076 |
| Decile 3 | 0.571438 |
| Decile 2 | 0.562108 |
| Decile 1 | 0.548566 |
| Minimum | 0 |
|
|
- Mean = 0.583099
- Std.dev = 0.028379
- 9 items below graph minimum of 0.481717
|
Notes
Weighted-mean FA (fractional anisotropy) in tract forceps major (from dMRI data)
0 Related Data-Fields
There are no related data-fields
2 Applications
| Application ID | Title |
|---|
| 17689 | Genetic, environmental and lifestyle predictors of brain/cognitive-related outcomes. |
| 22783 | The joint analysis of imaging data and genetic data for early tumor detection, prevention, diagnosis and treatment |

