Data
83,909 items of data are available, covering 79,382 participants.
Defined-instances run from 2 to 3, labelled using Instancing
2.
Units of measurement are AU.
| Maximum | 0.616408 |
| Decile 9 | 0.5627 |
| Decile 8 | 0.553254 |
| Decile 7 | 0.546353 |
| Decile 6 | 0.540446 |
| Median | 0.534729 |
| Decile 4 | 0.528812 |
| Decile 3 | 0.522364 |
| Decile 2 | 0.514573 |
| Decile 1 | 0.503156 |
| Minimum | 0 |
|
|
- Mean = 0.533367
- Std.dev = 0.0255648
- 115 items below graph minimum of 0.443612
|
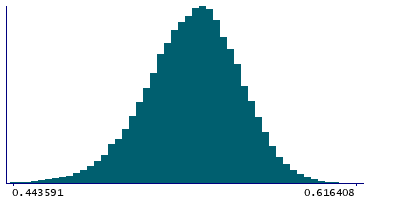
2 Instances
Instance 2 : Imaging visit (2014+)
79,151 participants, 79,151 items
| Maximum | 0.616408 |
| Decile 9 | 0.562783 |
| Decile 8 | 0.553326 |
| Decile 7 | 0.546416 |
| Decile 6 | 0.540471 |
| Median | 0.534775 |
| Decile 4 | 0.528845 |
| Decile 3 | 0.522397 |
| Decile 2 | 0.514618 |
| Decile 1 | 0.503161 |
| Minimum | 0 |
|

|
- Mean = 0.533419
- Std.dev = 0.0254967
- 109 items below graph minimum of 0.44354
|
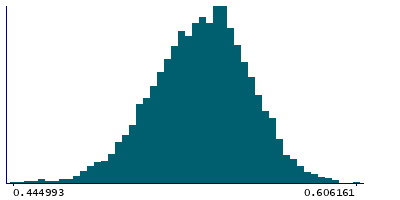
Instance 3 : First repeat imaging visit (2019+)
4,758 participants, 4,758 items
| Maximum | 0.606161 |
| Decile 9 | 0.561243 |
| Decile 8 | 0.552083 |
| Decile 7 | 0.545471 |
| Decile 6 | 0.539979 |
| Median | 0.534087 |
| Decile 4 | 0.528019 |
| Decile 3 | 0.521587 |
| Decile 2 | 0.513801 |
| Decile 1 | 0.503132 |
| Minimum | 0 |
|
|
- Mean = 0.532494
- Std.dev = 0.0266561
- 6 items below graph minimum of 0.44502
|
Notes
Weighted-mean FA (fractional anisotropy) in tract right corticospinal tract (from dMRI data)
0 Related Data-Fields
There are no related data-fields
2 Applications
| Application ID | Title |
|---|
| 17689 | Genetic, environmental and lifestyle predictors of brain/cognitive-related outcomes. |
| 22783 | The joint analysis of imaging data and genetic data for early tumor detection, prevention, diagnosis and treatment |

