Data
83,909 items of data are available, covering 79,382 participants.
Defined-instances run from 2 to 3, labelled using Instancing
2.
Units of measurement are AU.
| Maximum | 0.633241 |
| Decile 9 | 0.571434 |
| Decile 8 | 0.562247 |
| Decile 7 | 0.555507 |
| Decile 6 | 0.549662 |
| Median | 0.544041 |
| Decile 4 | 0.53835 |
| Decile 3 | 0.532076 |
| Decile 2 | 0.524622 |
| Decile 1 | 0.51379 |
| Minimum | 0 |
|
|
- Mean = 0.542947
- Std.dev = 0.0251159
- 149 items below graph minimum of 0.456147
- 1 item above graph maximum of 0.629077
|
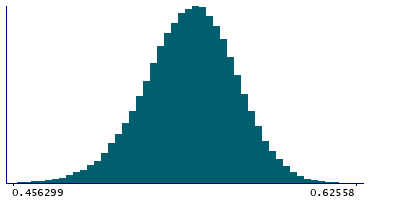
2 Instances
Instance 2 : Imaging visit (2014+)
79,151 participants, 79,151 items
| Maximum | 0.633241 |
| Decile 9 | 0.571489 |
| Decile 8 | 0.562277 |
| Decile 7 | 0.55552 |
| Decile 6 | 0.54967 |
| Median | 0.54405 |
| Decile 4 | 0.538359 |
| Decile 3 | 0.53207 |
| Decile 2 | 0.524583 |
| Decile 1 | 0.513777 |
| Minimum | 0 |
|

|
- Mean = 0.542959
- Std.dev = 0.0250493
- 137 items below graph minimum of 0.456065
- 1 item above graph maximum of 0.629202
|
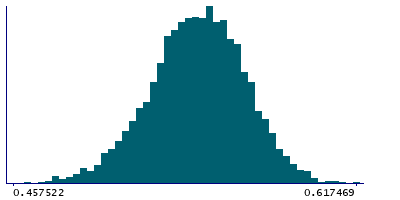
Instance 3 : First repeat imaging visit (2019+)
4,758 participants, 4,758 items
| Maximum | 0.617469 |
| Decile 9 | 0.570608 |
| Decile 8 | 0.561809 |
| Decile 7 | 0.555368 |
| Decile 6 | 0.549507 |
| Median | 0.543952 |
| Decile 4 | 0.538271 |
| Decile 3 | 0.532242 |
| Decile 2 | 0.525248 |
| Decile 1 | 0.514032 |
| Minimum | 0 |
|
|
- Mean = 0.542755
- Std.dev = 0.0261984
- 13 items below graph minimum of 0.457456
|
Notes
Weighted-mean FA (fractional anisotropy) in tract left corticospinal tract (from dMRI data)
0 Related Data-Fields
There are no related data-fields
2 Applications
| Application ID | Title |
|---|
| 17689 | Genetic, environmental and lifestyle predictors of brain/cognitive-related outcomes. |
| 22783 | The joint analysis of imaging data and genetic data for early tumor detection, prevention, diagnosis and treatment |

