Data
83,909 items of data are available, covering 79,382 participants.
Defined-instances run from 2 to 3, labelled using Instancing
2.
Units of measurement are AU.
| Maximum | 0.469123 |
| Decile 9 | 0.34386 |
| Decile 8 | 0.331134 |
| Decile 7 | 0.322099 |
| Decile 6 | 0.314408 |
| Median | 0.307239 |
| Decile 4 | 0.299927 |
| Decile 3 | 0.291736 |
| Decile 2 | 0.281732 |
| Decile 1 | 0.266148 |
| Minimum | 0 |
|

|
- Mean = 0.305353
- Std.dev = 0.0327784
- 320 items below graph minimum of 0.188435
- 17 items above graph maximum of 0.421572
|
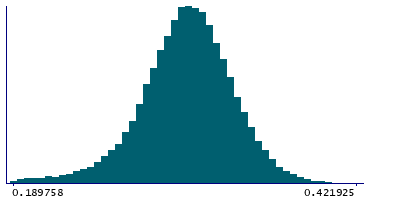
2 Instances
Instance 2 : Imaging visit (2014+)
79,151 participants, 79,151 items
| Maximum | 0.469123 |
| Decile 9 | 0.343947 |
| Decile 8 | 0.331214 |
| Decile 7 | 0.322193 |
| Decile 6 | 0.314494 |
| Median | 0.307307 |
| Decile 4 | 0.300002 |
| Decile 3 | 0.291756 |
| Decile 2 | 0.281796 |
| Decile 1 | 0.266121 |
| Minimum | 0 |
|
|
- Mean = 0.305404
- Std.dev = 0.0328447
- 309 items below graph minimum of 0.188296
- 17 items above graph maximum of 0.421772
|
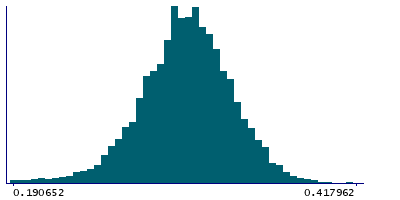
Instance 3 : First repeat imaging visit (2019+)
4,758 participants, 4,758 items
| Maximum | 0.419855 |
| Decile 9 | 0.342167 |
| Decile 8 | 0.329412 |
| Decile 7 | 0.32044 |
| Decile 6 | 0.312688 |
| Median | 0.305986 |
| Decile 4 | 0.298556 |
| Decile 3 | 0.291406 |
| Decile 2 | 0.280947 |
| Decile 1 | 0.266409 |
| Minimum | 0 |
|
|
- Mean = 0.304502
- Std.dev = 0.0316421
- 12 items below graph minimum of 0.190651
- 1 item above graph maximum of 0.417925
|
Notes
Weighted-mean FA (fractional anisotropy) in tract right parahippocampal part of cingulum (from dMRI data)
0 Related Data-Fields
There are no related data-fields
2 Applications
| Application ID | Title |
|---|
| 17689 | Genetic, environmental and lifestyle predictors of brain/cognitive-related outcomes. |
| 22783 | The joint analysis of imaging data and genetic data for early tumor detection, prevention, diagnosis and treatment |

