Data
83,909 items of data are available, covering 79,382 participants.
Defined-instances run from 2 to 3, labelled using Instancing
2.
Units of measurement are AU.
| Maximum | 0.491952 |
| Decile 9 | 0.412231 |
| Decile 8 | 0.404653 |
| Decile 7 | 0.399113 |
| Decile 6 | 0.394361 |
| Median | 0.389907 |
| Decile 4 | 0.385298 |
| Decile 3 | 0.380286 |
| Decile 2 | 0.37426 |
| Decile 1 | 0.365498 |
| Minimum | 0 |
|

|
- Mean = 0.389072
- Std.dev = 0.0198135
- 120 items below graph minimum of 0.318764
- 3 items above graph maximum of 0.458965
|
2 Instances
Instance 2 : Imaging visit (2014+)
79,151 participants, 79,151 items
| Maximum | 0.491952 |
| Decile 9 | 0.412249 |
| Decile 8 | 0.404661 |
| Decile 7 | 0.399116 |
| Decile 6 | 0.394364 |
| Median | 0.389888 |
| Decile 4 | 0.385261 |
| Decile 3 | 0.380246 |
| Decile 2 | 0.374204 |
| Decile 1 | 0.365436 |
| Minimum | 0 |
|

|
- Mean = 0.38906
- Std.dev = 0.019783
- 113 items below graph minimum of 0.318622
- 3 items above graph maximum of 0.459063
|
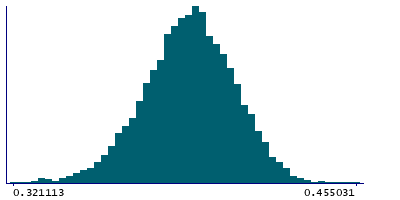
Instance 3 : First repeat imaging visit (2019+)
4,758 participants, 4,758 items
| Maximum | 0.455031 |
| Decile 9 | 0.412011 |
| Decile 8 | 0.404468 |
| Decile 7 | 0.39908 |
| Decile 6 | 0.394324 |
| Median | 0.390189 |
| Decile 4 | 0.385792 |
| Decile 3 | 0.381027 |
| Decile 2 | 0.375105 |
| Decile 1 | 0.366544 |
| Minimum | 0 |
|
|
- Mean = 0.389266
- Std.dev = 0.0203132
- 6 items below graph minimum of 0.321077
|
Notes
Weighted-mean FA (fractional anisotropy) in tract right anterior thalamic radiation (from dMRI data)
0 Related Data-Fields
There are no related data-fields
2 Applications
| Application ID | Title |
|---|
| 17689 | Genetic, environmental and lifestyle predictors of brain/cognitive-related outcomes. |
| 22783 | The joint analysis of imaging data and genetic data for early tumor detection, prevention, diagnosis and treatment |

