Data
83,909 items of data are available, covering 79,382 participants.
Defined-instances run from 2 to 3, labelled using Instancing
2.
Units of measurement are AU.
| Maximum | 0.512771 |
| Decile 9 | 0.436986 |
| Decile 8 | 0.427123 |
| Decile 7 | 0.420476 |
| Decile 6 | 0.414652 |
| Median | 0.409237 |
| Decile 4 | 0.403772 |
| Decile 3 | 0.398051 |
| Decile 2 | 0.3914 |
| Decile 1 | 0.38195 |
| Minimum | 0 |
|
|
- Mean = 0.409175
- Std.dev = 0.0230338
- 81 items below graph minimum of 0.326915
- 25 items above graph maximum of 0.492022
|
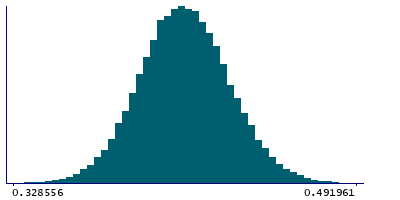
2 Instances
Instance 2 : Imaging visit (2014+)
79,151 participants, 79,151 items
| Maximum | 0.512771 |
| Decile 9 | 0.436979 |
| Decile 8 | 0.427117 |
| Decile 7 | 0.420516 |
| Decile 6 | 0.4147 |
| Median | 0.409299 |
| Decile 4 | 0.403811 |
| Decile 3 | 0.398049 |
| Decile 2 | 0.391389 |
| Decile 1 | 0.381889 |
| Minimum | 0 |
|

|
- Mean = 0.409191
- Std.dev = 0.0229951
- 74 items below graph minimum of 0.326799
- 24 items above graph maximum of 0.492069
|
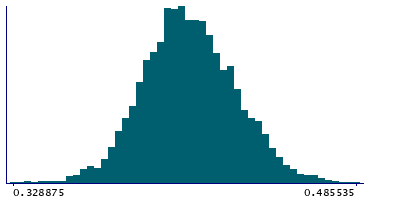
Instance 3 : First repeat imaging visit (2019+)
4,758 participants, 4,758 items
| Maximum | 0.485535 |
| Decile 9 | 0.437073 |
| Decile 8 | 0.427235 |
| Decile 7 | 0.419664 |
| Decile 6 | 0.413923 |
| Median | 0.408259 |
| Decile 4 | 0.403136 |
| Decile 3 | 0.398111 |
| Decile 2 | 0.391545 |
| Decile 1 | 0.382964 |
| Minimum | 0 |
|
|
- Mean = 0.408915
- Std.dev = 0.0236666
- 6 items below graph minimum of 0.328854
|
Notes
Weighted-mean FA (fractional anisotropy) in tract right acoustic radiation (from dMRI data)
0 Related Data-Fields
There are no related data-fields
2 Applications
| Application ID | Title |
|---|
| 17689 | Genetic, environmental and lifestyle predictors of brain/cognitive-related outcomes. |
| 22783 | The joint analysis of imaging data and genetic data for early tumor detection, prevention, diagnosis and treatment |

