Data
83,906 items of data are available, covering 79,379 participants.
Defined-instances run from 2 to 3, labelled using Instancing
2.
Units of measurement are AU.
| Maximum | 1 |
| Decile 9 | 0.218878 |
| Decile 8 | 0.206508 |
| Decile 7 | 0.196882 |
| Decile 6 | 0.188497 |
| Median | 0.180331 |
| Decile 4 | 0.172042 |
| Decile 3 | 0.163184 |
| Decile 2 | 0.153139 |
| Decile 1 | 0.139818 |
| Minimum | 0.04775 |
|
|
- Mean = 0.179981
- Std.dev = 0.0311617
- 48 items above graph maximum of 0.297938
|
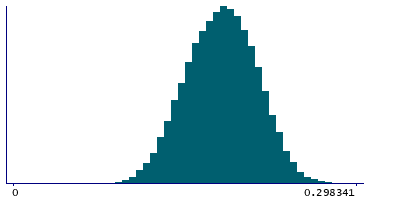
2 Instances
Instance 2 : Imaging visit (2014+)
79,148 participants, 79,148 items
| Maximum | 1 |
| Decile 9 | 0.218725 |
| Decile 8 | 0.206375 |
| Decile 7 | 0.196748 |
| Decile 6 | 0.188383 |
| Median | 0.180219 |
| Decile 4 | 0.171934 |
| Decile 3 | 0.163112 |
| Decile 2 | 0.153006 |
| Decile 1 | 0.139685 |
| Minimum | 0.04775 |
|

|
- Mean = 0.179857
- Std.dev = 0.0311384
- 44 items above graph maximum of 0.297765
|
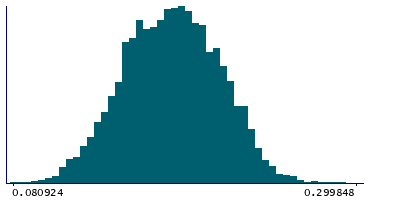
Instance 3 : First repeat imaging visit (2019+)
4,758 participants, 4,758 items
| Maximum | 0.549977 |
| Decile 9 | 0.221162 |
| Decile 8 | 0.209072 |
| Decile 7 | 0.199149 |
| Decile 6 | 0.190315 |
| Median | 0.182075 |
| Decile 4 | 0.173686 |
| Decile 3 | 0.164416 |
| Decile 2 | 0.155046 |
| Decile 1 | 0.14246 |
| Minimum | 0.080924 |
|
|
- Mean = 0.182058
- Std.dev = 0.0314754
- 4 items above graph maximum of 0.299865
|
Notes
Mean OD (orientation dispersion index) in superior fronto-occipital fasciculus (right) on FA (fractional anisotropy) skeleton (from dMRI data)
0 Related Data-Fields
There are no related data-fields
2 Applications
| Application ID | Title |
|---|
| 17689 | Genetic, environmental and lifestyle predictors of brain/cognitive-related outcomes. |
| 22783 | The joint analysis of imaging data and genetic data for early tumor detection, prevention, diagnosis and treatment |

