Data
83,906 items of data are available, covering 79,379 participants.
Defined-instances run from 2 to 3, labelled using Instancing
2.
Units of measurement are AU.
| Maximum | 0.720171 |
| Decile 9 | 0.159069 |
| Decile 8 | 0.151836 |
| Decile 7 | 0.14679 |
| Decile 6 | 0.142699 |
| Median | 0.138959 |
| Decile 4 | 0.13531 |
| Decile 3 | 0.131548 |
| Decile 2 | 0.127256 |
| Decile 1 | 0.121462 |
| Minimum | 0.087203 |
|
|
- Mean = 0.139905
- Std.dev = 0.0157609
- 156 items above graph maximum of 0.196676
|
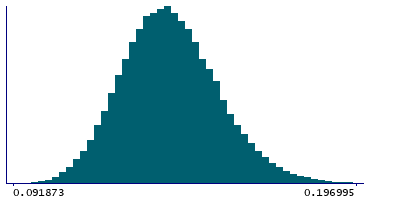
2 Instances
Instance 2 : Imaging visit (2014+)
79,148 participants, 79,148 items
| Maximum | 0.523023 |
| Decile 9 | 0.159017 |
| Decile 8 | 0.151787 |
| Decile 7 | 0.146753 |
| Decile 6 | 0.142643 |
| Median | 0.138877 |
| Decile 4 | 0.135239 |
| Decile 3 | 0.131477 |
| Decile 2 | 0.127191 |
| Decile 1 | 0.121405 |
| Minimum | 0.087203 |
|

|
- Mean = 0.139841
- Std.dev = 0.0156379
- 144 items above graph maximum of 0.196629
|
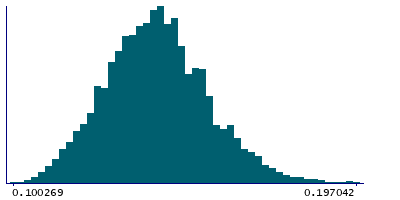
Instance 3 : First repeat imaging visit (2019+)
4,758 participants, 4,758 items
| Maximum | 0.720171 |
| Decile 9 | 0.159787 |
| Decile 8 | 0.152466 |
| Decile 7 | 0.147325 |
| Decile 6 | 0.143714 |
| Median | 0.140293 |
| Decile 4 | 0.136663 |
| Decile 3 | 0.132685 |
| Decile 2 | 0.128395 |
| Decile 1 | 0.122536 |
| Minimum | 0.100269 |
|
|
- Mean = 0.140956
- Std.dev = 0.0176475
- 12 items above graph maximum of 0.197039
|
Notes
Mean OD (orientation dispersion index) in superior longitudinal fasciculus (right) on FA (fractional anisotropy) skeleton (from dMRI data)
0 Related Data-Fields
There are no related data-fields
2 Applications
| Application ID | Title |
|---|
| 17689 | Genetic, environmental and lifestyle predictors of brain/cognitive-related outcomes. |
| 22783 | The joint analysis of imaging data and genetic data for early tumor detection, prevention, diagnosis and treatment |

