Data
83,906 items of data are available, covering 79,379 participants.
Defined-instances run from 2 to 3, labelled using Instancing
2.
Units of measurement are AU.
| Maximum | 0.701793 |
| Decile 9 | 0.213869 |
| Decile 8 | 0.199554 |
| Decile 7 | 0.190221 |
| Decile 6 | 0.18237 |
| Median | 0.175447 |
| Decile 4 | 0.168708 |
| Decile 3 | 0.161844 |
| Decile 2 | 0.154277 |
| Decile 1 | 0.14424 |
| Minimum | 0 |
|
|
- Mean = 0.177896
- Std.dev = 0.0287488
- 3 items below graph minimum of 0.074611
- 251 items above graph maximum of 0.283498
|
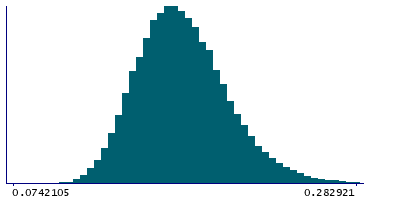
2 Instances
Instance 2 : Imaging visit (2014+)
79,148 participants, 79,148 items
| Maximum | 0.701793 |
| Decile 9 | 0.213865 |
| Decile 8 | 0.199531 |
| Decile 7 | 0.190134 |
| Decile 6 | 0.182305 |
| Median | 0.175391 |
| Decile 4 | 0.168661 |
| Decile 3 | 0.161783 |
| Decile 2 | 0.154212 |
| Decile 1 | 0.144155 |
| Minimum | 0 |
|

|
- Mean = 0.177841
- Std.dev = 0.0287482
- 3 items below graph minimum of 0.074444
- 236 items above graph maximum of 0.283575
|
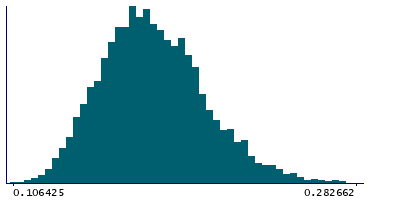
Instance 3 : First repeat imaging visit (2019+)
4,758 participants, 4,758 items
| Maximum | 0.551433 |
| Decile 9 | 0.214134 |
| Decile 8 | 0.199904 |
| Decile 7 | 0.191346 |
| Decile 6 | 0.183568 |
| Median | 0.176397 |
| Decile 4 | 0.169785 |
| Decile 3 | 0.163114 |
| Decile 2 | 0.155508 |
| Decile 1 | 0.145553 |
| Minimum | 0.106425 |
|
|
- Mean = 0.178823
- Std.dev = 0.0287436
- 15 items above graph maximum of 0.282714
|
Notes
Mean OD (orientation dispersion index) in cingulum hippocampus (left) on FA (fractional anisotropy) skeleton (from dMRI data)
0 Related Data-Fields
There are no related data-fields
2 Applications
| Application ID | Title |
|---|
| 17689 | Genetic, environmental and lifestyle predictors of brain/cognitive-related outcomes. |
| 22783 | The joint analysis of imaging data and genetic data for early tumor detection, prevention, diagnosis and treatment |

