Data
83,906 items of data are available, covering 79,379 participants.
Defined-instances run from 2 to 3, labelled using Instancing
2.
Units of measurement are AU.
| Maximum | 0.695361 |
| Decile 9 | 0.210463 |
| Decile 8 | 0.196216 |
| Decile 7 | 0.186679 |
| Decile 6 | 0.179031 |
| Median | 0.172274 |
| Decile 4 | 0.165818 |
| Decile 3 | 0.159099 |
| Decile 2 | 0.151894 |
| Decile 1 | 0.142396 |
| Minimum | 0 |
|
|
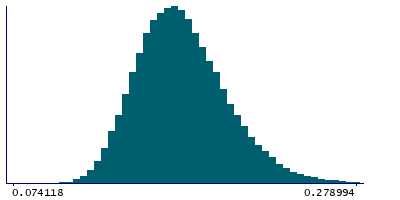
- Mean = 0.174936
- Std.dev = 0.0280365
- 3 items below graph minimum of 0.07433
- 195 items above graph maximum of 0.27853
|
2 Instances
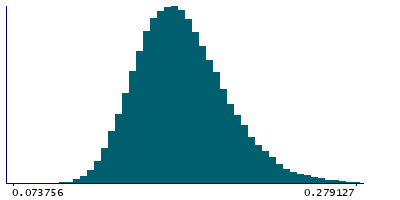
Instance 2 : Imaging visit (2014+)
79,148 participants, 79,148 items
| Maximum | 0.695361 |
| Decile 9 | 0.210402 |
| Decile 8 | 0.196136 |
| Decile 7 | 0.186562 |
| Decile 6 | 0.178918 |
| Median | 0.172106 |
| Decile 4 | 0.165604 |
| Decile 3 | 0.158948 |
| Decile 2 | 0.151728 |
| Decile 1 | 0.142238 |
| Minimum | 0 |
|
|
- Mean = 0.174809
- Std.dev = 0.0280481
- 3 items below graph minimum of 0.0740745
- 186 items above graph maximum of 0.278566
|
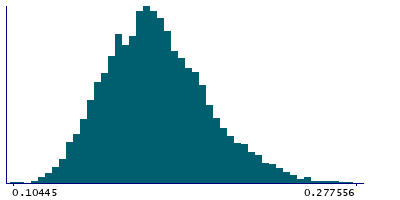
Instance 3 : First repeat imaging visit (2019+)
4,758 participants, 4,758 items
| Maximum | 0.584967 |
| Decile 9 | 0.211324 |
| Decile 8 | 0.197699 |
| Decile 7 | 0.188545 |
| Decile 6 | 0.180988 |
| Median | 0.174791 |
| Decile 4 | 0.168886 |
| Decile 3 | 0.162106 |
| Decile 2 | 0.154647 |
| Decile 1 | 0.145091 |
| Minimum | 0.10445 |
|
|
- Mean = 0.177044
- Std.dev = 0.0277568
- 8 items above graph maximum of 0.277557
|
Notes
Mean OD (orientation dispersion index) in cingulum hippocampus (right) on FA (fractional anisotropy) skeleton (from dMRI data)
0 Related Data-Fields
There are no related data-fields
2 Applications
| Application ID | Title |
|---|
| 17689 | Genetic, environmental and lifestyle predictors of brain/cognitive-related outcomes. |
| 22783 | The joint analysis of imaging data and genetic data for early tumor detection, prevention, diagnosis and treatment |

