Data
83,906 items of data are available, covering 79,379 participants.
Defined-instances run from 2 to 3, labelled using Instancing
2.
Units of measurement are AU.
| Maximum | 0.583197 |
| Decile 9 | 0.202669 |
| Decile 8 | 0.195113 |
| Decile 7 | 0.189789 |
| Decile 6 | 0.185258 |
| Median | 0.180997 |
| Decile 4 | 0.176694 |
| Decile 3 | 0.1721 |
| Decile 2 | 0.166692 |
| Decile 1 | 0.159196 |
| Minimum | 0.09563 |
|

|
- Mean = 0.181083
- Std.dev = 0.0177958
- 3 items below graph minimum of 0.115723
- 57 items above graph maximum of 0.246142
|
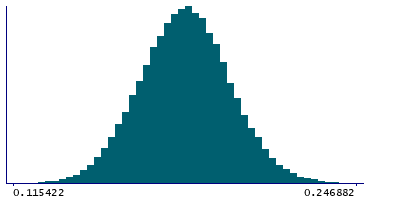
2 Instances
Instance 2 : Imaging visit (2014+)
79,148 participants, 79,148 items
| Maximum | 0.583197 |
| Decile 9 | 0.202594 |
| Decile 8 | 0.195072 |
| Decile 7 | 0.189743 |
| Decile 6 | 0.18524 |
| Median | 0.18097 |
| Decile 4 | 0.176683 |
| Decile 3 | 0.172106 |
| Decile 2 | 0.166698 |
| Decile 1 | 0.159209 |
| Minimum | 0.09563 |
|
|
- Mean = 0.181061
- Std.dev = 0.0177118
- 4 items below graph minimum of 0.115824
- 53 items above graph maximum of 0.245979
|
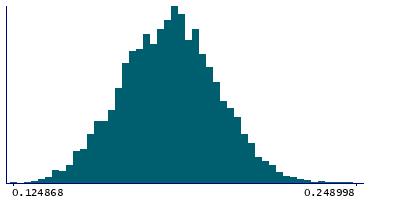
Instance 3 : First repeat imaging visit (2019+)
4,758 participants, 4,758 items
| Maximum | 0.530524 |
| Decile 9 | 0.203866 |
| Decile 8 | 0.195802 |
| Decile 7 | 0.190389 |
| Decile 6 | 0.185503 |
| Median | 0.181453 |
| Decile 4 | 0.176931 |
| Decile 3 | 0.171893 |
| Decile 2 | 0.166481 |
| Decile 1 | 0.158695 |
| Minimum | 0.124868 |
|
|
- Mean = 0.181449
- Std.dev = 0.0191351
- 3 items above graph maximum of 0.249037
|
Notes
Mean OD (orientation dispersion index) in anterior corona radiata (left) on FA (fractional anisotropy) skeleton (from dMRI data)
0 Related Data-Fields
There are no related data-fields
2 Applications
| Application ID | Title |
|---|
| 17689 | Genetic, environmental and lifestyle predictors of brain/cognitive-related outcomes. |
| 22783 | The joint analysis of imaging data and genetic data for early tumor detection, prevention, diagnosis and treatment |

