Data
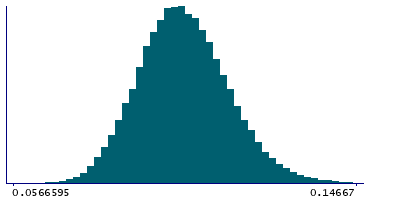
83,906 items of data are available, covering 79,379 participants.
Defined-instances run from 2 to 3, labelled using Instancing
2.
Units of measurement are AU.
| Maximum | 0.574056 |
| Decile 9 | 0.116553 |
| Decile 8 | 0.110868 |
| Decile 7 | 0.106927 |
| Decile 6 | 0.103653 |
| Median | 0.100588 |
| Decile 4 | 0.097687 |
| Decile 3 | 0.09463 |
| Decile 2 | 0.0911705 |
| Decile 1 | 0.086357 |
| Minimum | 0 |
|

|
- Mean = 0.101265
- Std.dev = 0.0132222
- 1 item below graph minimum of 0.0561615
- 87 items above graph maximum of 0.146748
|
2 Instances
Instance 2 : Imaging visit (2014+)
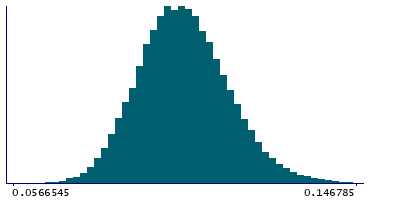
79,148 participants, 79,148 items
| Maximum | 0.574056 |
| Decile 9 | 0.116524 |
| Decile 8 | 0.110856 |
| Decile 7 | 0.106912 |
| Decile 6 | 0.10362 |
| Median | 0.100563 |
| Decile 4 | 0.0976515 |
| Decile 3 | 0.0945905 |
| Decile 2 | 0.0911465 |
| Decile 1 | 0.0863195 |
| Minimum | 0 |
|

|
- Mean = 0.101233
- Std.dev = 0.0131989
- 1 item below graph minimum of 0.056115
- 81 items above graph maximum of 0.146729
|
Instance 3 : First repeat imaging visit (2019+)
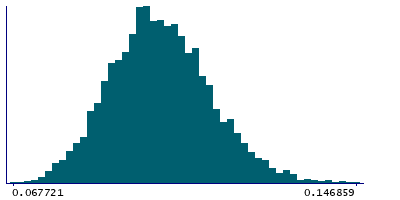
4,758 participants, 4,758 items
| Maximum | 0.485042 |
| Decile 9 | 0.117016 |
| Decile 8 | 0.111037 |
| Decile 7 | 0.107229 |
| Decile 6 | 0.104129 |
| Median | 0.101087 |
| Decile 4 | 0.0982325 |
| Decile 3 | 0.095418 |
| Decile 2 | 0.091653 |
| Decile 1 | 0.087155 |
| Minimum | 0.067721 |
|

|
- Mean = 0.101812
- Std.dev = 0.0135922
- 5 items above graph maximum of 0.146877
|
Notes
Mean OD (orientation dispersion index) in posterior limb of internal capsule (left) on FA (fractional anisotropy) skeleton (from dMRI data)
0 Related Data-Fields
There are no related data-fields
2 Applications
| Application ID | Title |
|---|
| 17689 | Genetic, environmental and lifestyle predictors of brain/cognitive-related outcomes. |
| 22783 | The joint analysis of imaging data and genetic data for early tumor detection, prevention, diagnosis and treatment |


