Data
83,906 items of data are available, covering 79,379 participants.
Defined-instances run from 2 to 3, labelled using Instancing
2.
Units of measurement are AU.
| Maximum | 0.559137 |
| Decile 9 | 0.121159 |
| Decile 8 | 0.115798 |
| Decile 7 | 0.112171 |
| Decile 6 | 0.109193 |
| Median | 0.106454 |
| Decile 4 | 0.103751 |
| Decile 3 | 0.100946 |
| Decile 2 | 0.097738 |
| Decile 1 | 0.0934825 |
| Minimum | 0 |
|

|
- Mean = 0.107132
- Std.dev = 0.0127135
- 4 items below graph minimum of 0.065806
- 194 items above graph maximum of 0.148836
|
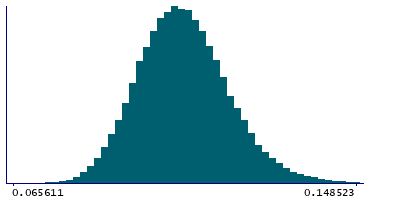
2 Instances
Instance 2 : Imaging visit (2014+)
79,148 participants, 79,148 items
| Maximum | 0.559137 |
| Decile 9 | 0.121199 |
| Decile 8 | 0.115804 |
| Decile 7 | 0.112171 |
| Decile 6 | 0.109183 |
| Median | 0.10644 |
| Decile 4 | 0.103733 |
| Decile 3 | 0.100932 |
| Decile 2 | 0.09773 |
| Decile 1 | 0.093466 |
| Minimum | 0 |
|
|
- Mean = 0.107124
- Std.dev = 0.0126599
- 4 items below graph minimum of 0.065733
- 182 items above graph maximum of 0.148932
|
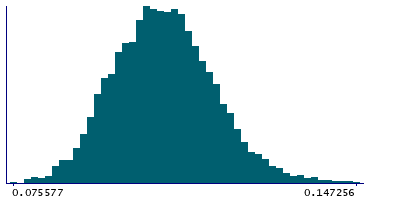
Instance 3 : First repeat imaging visit (2019+)
4,758 participants, 4,758 items
| Maximum | 0.489529 |
| Decile 9 | 0.120537 |
| Decile 8 | 0.115699 |
| Decile 7 | 0.112156 |
| Decile 6 | 0.109412 |
| Median | 0.106638 |
| Decile 4 | 0.104007 |
| Decile 3 | 0.101238 |
| Decile 2 | 0.097889 |
| Decile 1 | 0.0938025 |
| Minimum | 0.075577 |
|
|
- Mean = 0.107265
- Std.dev = 0.0135728
- 11 items above graph maximum of 0.147271
|
Notes
Mean OD (orientation dispersion index) in cerebral peduncle (left) on FA (fractional anisotropy) skeleton (from dMRI data)
0 Related Data-Fields
There are no related data-fields
2 Applications
| Application ID | Title |
|---|
| 17689 | Genetic, environmental and lifestyle predictors of brain/cognitive-related outcomes. |
| 22783 | The joint analysis of imaging data and genetic data for early tumor detection, prevention, diagnosis and treatment |

