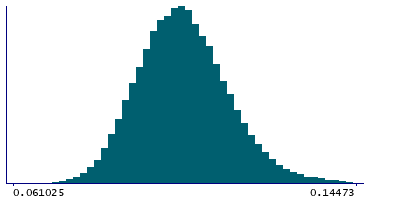
Data
83,906 items of data are available, covering 79,379 participants.
Defined-instances run from 2 to 3, labelled using Instancing
2.
Units of measurement are AU.
| Maximum | 0.591809 |
| Decile 9 | 0.117375 |
| Decile 8 | 0.111899 |
| Decile 7 | 0.108205 |
| Decile 6 | 0.105108 |
| Median | 0.102374 |
| Decile 4 | 0.099683 |
| Decile 3 | 0.096837 |
| Decile 2 | 0.093667 |
| Decile 1 | 0.0893735 |
| Minimum | 0 |
|
|
- Mean = 0.103155
- Std.dev = 0.0129809
- 3 items below graph minimum of 0.0613715
- 183 items above graph maximum of 0.145377
|
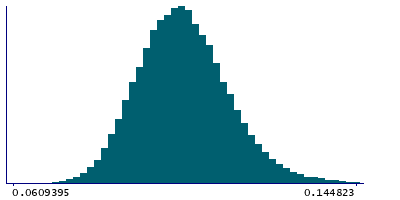
2 Instances
Instance 2 : Imaging visit (2014+)
79,148 participants, 79,148 items
| Maximum | 0.570205 |
| Decile 9 | 0.117433 |
| Decile 8 | 0.111937 |
| Decile 7 | 0.10823 |
| Decile 6 | 0.105139 |
| Median | 0.102402 |
| Decile 4 | 0.099697 |
| Decile 3 | 0.096847 |
| Decile 2 | 0.093671 |
| Decile 1 | 0.0893795 |
| Minimum | 0 |
|
|
- Mean = 0.103176
- Std.dev = 0.0128078
- 3 items below graph minimum of 0.061326
- 170 items above graph maximum of 0.145486
|
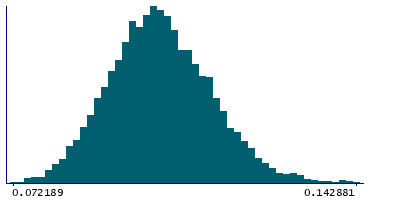
Instance 3 : First repeat imaging visit (2019+)
4,758 participants, 4,758 items
| Maximum | 0.591809 |
| Decile 9 | 0.116079 |
| Decile 8 | 0.11128 |
| Decile 7 | 0.107683 |
| Decile 6 | 0.104579 |
| Median | 0.10198 |
| Decile 4 | 0.0994965 |
| Decile 3 | 0.0966995 |
| Decile 2 | 0.0935555 |
| Decile 1 | 0.0892745 |
| Minimum | 0.072189 |
|
|
- Mean = 0.102803
- Std.dev = 0.0155759
- 9 items above graph maximum of 0.142883
|
Notes
Mean OD (orientation dispersion index) in cerebral peduncle (right) on FA (fractional anisotropy) skeleton (from dMRI data)
0 Related Data-Fields
There are no related data-fields
2 Applications
| Application ID | Title |
|---|
| 17689 | Genetic, environmental and lifestyle predictors of brain/cognitive-related outcomes. |
| 22783 | The joint analysis of imaging data and genetic data for early tumor detection, prevention, diagnosis and treatment |

