Data
83,906 items of data are available, covering 79,379 participants.
Defined-instances run from 2 to 3, labelled using Instancing
2.
Units of measurement are AU.
| Maximum | 0.564007 |
| Decile 9 | 0.089341 |
| Decile 8 | 0.0856245 |
| Decile 7 | 0.083097 |
| Decile 6 | 0.081012 |
| Median | 0.079091 |
| Decile 4 | 0.077235 |
| Decile 3 | 0.075356 |
| Decile 2 | 0.0731725 |
| Decile 1 | 0.070277 |
| Minimum | 0 |
|

|
- Mean = 0.0797613
- Std.dev = 0.0100804
- 3 items below graph minimum of 0.051213
- 292 items above graph maximum of 0.108405
|
2 Instances
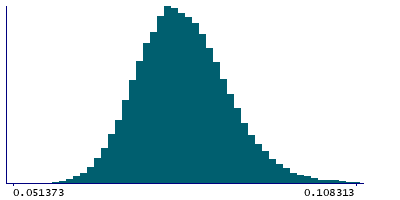
Instance 2 : Imaging visit (2014+)
79,148 participants, 79,148 items
| Maximum | 0.564007 |
| Decile 9 | 0.0892525 |
| Decile 8 | 0.08555 |
| Decile 7 | 0.083019 |
| Decile 6 | 0.080925 |
| Median | 0.07901 |
| Decile 4 | 0.077168 |
| Decile 3 | 0.075278 |
| Decile 2 | 0.0731 |
| Decile 1 | 0.070227 |
| Minimum | 0 |
|
|
- Mean = 0.0796913
- Std.dev = 0.0100404
- 3 items below graph minimum of 0.0512015
- 280 items above graph maximum of 0.108278
|
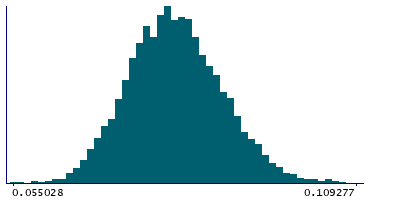
Instance 3 : First repeat imaging visit (2019+)
4,758 participants, 4,758 items
| Maximum | 0.479325 |
| Decile 9 | 0.090356 |
| Decile 8 | 0.0868895 |
| Decile 7 | 0.084275 |
| Decile 6 | 0.08227 |
| Median | 0.080292 |
| Decile 4 | 0.078569 |
| Decile 3 | 0.0764735 |
| Decile 2 | 0.074387 |
| Decile 1 | 0.0714235 |
| Minimum | 0.055028 |
|
|
- Mean = 0.080927
- Std.dev = 0.0106571
- 15 items above graph maximum of 0.109288
|
Notes
Mean OD (orientation dispersion index) in superior cerebellar peduncle (left) on FA (fractional anisotropy) skeleton (from dMRI data)
0 Related Data-Fields
There are no related data-fields
Problem running reference query
0 Resources
There are no matching Resources
2 Applications
| Application ID | Title |
|---|
| 17689 | Genetic, environmental and lifestyle predictors of brain/cognitive-related outcomes. |
| 22783 | The joint analysis of imaging data and genetic data for early tumor detection, prevention, diagnosis and treatment |
