Data
83,906 items of data are available, covering 79,379 participants.
Defined-instances run from 2 to 3, labelled using Instancing
2.
Units of measurement are AU.
| Maximum | 0.557323 |
| Decile 9 | 0.090803 |
| Decile 8 | 0.0870375 |
| Decile 7 | 0.0845115 |
| Decile 6 | 0.082465 |
| Median | 0.080575 |
| Decile 4 | 0.07877 |
| Decile 3 | 0.076887 |
| Decile 2 | 0.074793 |
| Decile 1 | 0.0719245 |
| Minimum | 0 |
|

|
- Mean = 0.0812766
- Std.dev = 0.0100356
- 3 items below graph minimum of 0.053046
- 299 items above graph maximum of 0.109681
|
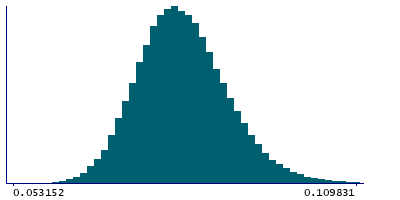
2 Instances
Instance 2 : Imaging visit (2014+)
79,148 participants, 79,148 items
| Maximum | 0.557323 |
| Decile 9 | 0.0907 |
| Decile 8 | 0.086942 |
| Decile 7 | 0.0844105 |
| Decile 6 | 0.082374 |
| Median | 0.080489 |
| Decile 4 | 0.0786755 |
| Decile 3 | 0.076806 |
| Decile 2 | 0.0747095 |
| Decile 1 | 0.07186 |
| Minimum | 0 |
|
|
- Mean = 0.0811824
- Std.dev = 0.00995804
- 3 items below graph minimum of 0.05302
- 284 items above graph maximum of 0.10954
|
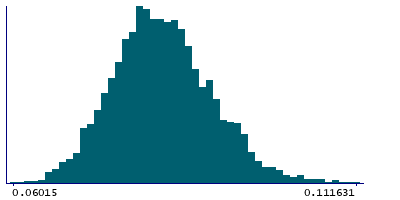
Instance 3 : First repeat imaging visit (2019+)
4,758 participants, 4,758 items
| Maximum | 0.520106 |
| Decile 9 | 0.092483 |
| Decile 8 | 0.088736 |
| Decile 7 | 0.0860615 |
| Decile 6 | 0.084057 |
| Median | 0.082145 |
| Decile 4 | 0.080249 |
| Decile 3 | 0.0784435 |
| Decile 2 | 0.076352 |
| Decile 1 | 0.073319 |
| Minimum | 0.06015 |
|
|
- Mean = 0.0828433
- Std.dev = 0.0111306
- 16 items above graph maximum of 0.111647
|
Notes
Mean OD (orientation dispersion index) in superior cerebellar peduncle (right) on FA (fractional anisotropy) skeleton (from dMRI data)
0 Related Data-Fields
There are no related data-fields
2 Applications
| Application ID | Title |
|---|
| 17689 | Genetic, environmental and lifestyle predictors of brain/cognitive-related outcomes. |
| 22783 | The joint analysis of imaging data and genetic data for early tumor detection, prevention, diagnosis and treatment |

