Data
83,906 items of data are available, covering 79,379 participants.
Defined-instances run from 2 to 3, labelled using Instancing
2.
Units of measurement are AU.
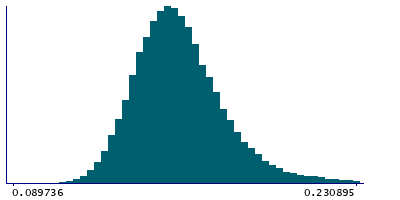
| Maximum | 0.692895 |
| Decile 9 | 0.184881 |
| Decile 8 | 0.173575 |
| Decile 7 | 0.166824 |
| Decile 6 | 0.161699 |
| Median | 0.157168 |
| Decile 4 | 0.152943 |
| Decile 3 | 0.148543 |
| Decile 2 | 0.143618 |
| Decile 1 | 0.137176 |
| Minimum | 0 |
|
|
- Mean = 0.160474
- Std.dev = 0.0236918
- 3 items below graph minimum of 0.0894695
- 1216 items above graph maximum of 0.232587
|
2 Instances
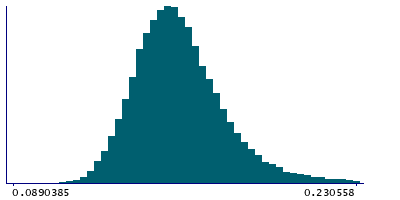
Instance 2 : Imaging visit (2014+)
79,148 participants, 79,148 items
| Maximum | 0.590824 |
| Decile 9 | 0.184939 |
| Decile 8 | 0.173596 |
| Decile 7 | 0.166854 |
| Decile 6 | 0.161693 |
| Median | 0.157166 |
| Decile 4 | 0.152952 |
| Decile 3 | 0.148533 |
| Decile 2 | 0.143599 |
| Decile 1 | 0.13715 |
| Minimum | 0 |
|
|
- Mean = 0.160459
- Std.dev = 0.023596
- 3 items below graph minimum of 0.0893615
- 1126 items above graph maximum of 0.232727
|
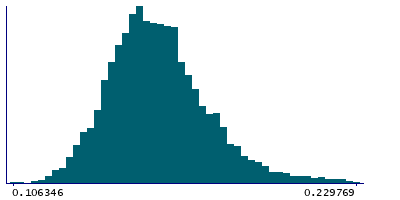
Instance 3 : First repeat imaging visit (2019+)
4,758 participants, 4,758 items
| Maximum | 0.692895 |
| Decile 9 | 0.183947 |
| Decile 8 | 0.173152 |
| Decile 7 | 0.166293 |
| Decile 6 | 0.161904 |
| Median | 0.15724 |
| Decile 4 | 0.152682 |
| Decile 3 | 0.148679 |
| Decile 2 | 0.143977 |
| Decile 1 | 0.137968 |
| Minimum | 0.106346 |
|
|
- Mean = 0.160729
- Std.dev = 0.0252306
- 88 items above graph maximum of 0.229926
|
Notes
Mean OD (orientation dispersion index) in inferior cerebellar peduncle (left) on FA (fractional anisotropy) skeleton (from dMRI data)
0 Related Data-Fields
There are no related data-fields
Problem running reference query
0 Resources
There are no matching Resources
2 Applications
| Application ID | Title |
|---|
| 17689 | Genetic, environmental and lifestyle predictors of brain/cognitive-related outcomes. |
| 22783 | The joint analysis of imaging data and genetic data for early tumor detection, prevention, diagnosis and treatment |
