Data
83,906 items of data are available, covering 79,379 participants.
Defined-instances run from 2 to 3, labelled using Instancing
2.
Units of measurement are AU.
| Maximum | 0.668761 |
| Decile 9 | 0.185889 |
| Decile 8 | 0.174886 |
| Decile 7 | 0.167925 |
| Decile 6 | 0.162353 |
| Median | 0.157642 |
| Decile 4 | 0.153027 |
| Decile 3 | 0.148204 |
| Decile 2 | 0.142994 |
| Decile 1 | 0.136084 |
| Minimum | 0 |
|
|
- Mean = 0.160597
- Std.dev = 0.0241948
- 3 items below graph minimum of 0.0862795
- 1064 items above graph maximum of 0.235693
|
2 Instances
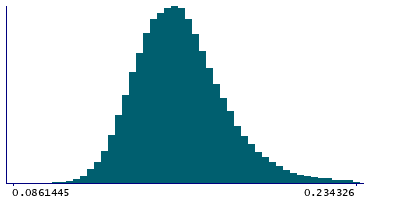
Instance 2 : Imaging visit (2014+)
79,148 participants, 79,148 items
| Maximum | 0.548752 |
| Decile 9 | 0.185895 |
| Decile 8 | 0.174909 |
| Decile 7 | 0.167938 |
| Decile 6 | 0.162349 |
| Median | 0.157633 |
| Decile 4 | 0.153014 |
| Decile 3 | 0.148172 |
| Decile 2 | 0.142958 |
| Decile 1 | 0.136045 |
| Minimum | 0 |
|

|
- Mean = 0.160568
- Std.dev = 0.0241102
- 3 items below graph minimum of 0.0861965
- 988 items above graph maximum of 0.235744
|
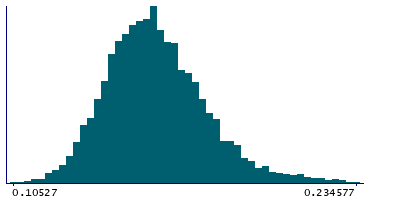
Instance 3 : First repeat imaging visit (2019+)
4,758 participants, 4,758 items
| Maximum | 0.668761 |
| Decile 9 | 0.185721 |
| Decile 8 | 0.174597 |
| Decile 7 | 0.167716 |
| Decile 6 | 0.162455 |
| Median | 0.157766 |
| Decile 4 | 0.153205 |
| Decile 3 | 0.148669 |
| Decile 2 | 0.143569 |
| Decile 1 | 0.136851 |
| Minimum | 0.10527 |
|
|
- Mean = 0.161088
- Std.dev = 0.0255553
- 78 items above graph maximum of 0.234592
|
Notes
Mean OD (orientation dispersion index) in inferior cerebellar peduncle (right) on FA (fractional anisotropy) skeleton (from dMRI data)
0 Related Data-Fields
There are no related data-fields
2 Applications
| Application ID | Title |
|---|
| 17689 | Genetic, environmental and lifestyle predictors of brain/cognitive-related outcomes. |
| 22783 | The joint analysis of imaging data and genetic data for early tumor detection, prevention, diagnosis and treatment |

