Data
83,906 items of data are available, covering 79,379 participants.
Defined-instances run from 2 to 3, labelled using Instancing
2.
Units of measurement are AU.
| Maximum | 0.617431 |
| Decile 9 | 0.12251 |
| Decile 8 | 0.115213 |
| Decile 7 | 0.110482 |
| Decile 6 | 0.106733 |
| Median | 0.103365 |
| Decile 4 | 0.100172 |
| Decile 3 | 0.0968895 |
| Decile 2 | 0.0932335 |
| Decile 1 | 0.088439 |
| Minimum | 0 |
|

|
- Mean = 0.104995
- Std.dev = 0.0162007
- 3 items below graph minimum of 0.0543675
- 475 items above graph maximum of 0.156582
|
2 Instances
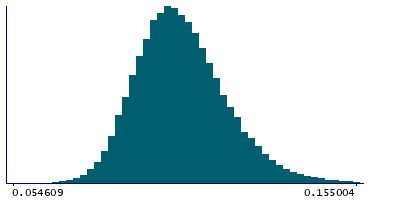
Instance 2 : Imaging visit (2014+)
79,148 participants, 79,148 items
| Maximum | 0.520942 |
| Decile 9 | 0.122673 |
| Decile 8 | 0.115341 |
| Decile 7 | 0.110588 |
| Decile 6 | 0.106813 |
| Median | 0.103441 |
| Decile 4 | 0.100223 |
| Decile 3 | 0.0969445 |
| Decile 2 | 0.0933075 |
| Decile 1 | 0.088497 |
| Minimum | 0 |
|
|
- Mean = 0.105071
- Std.dev = 0.0161373
- 3 items below graph minimum of 0.054321
- 443 items above graph maximum of 0.156849
|
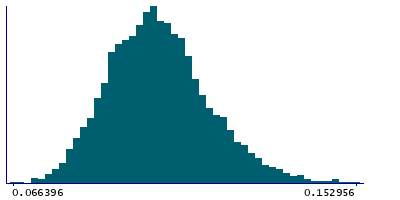
Instance 3 : First repeat imaging visit (2019+)
4,758 participants, 4,758 items
| Maximum | 0.617431 |
| Decile 9 | 0.120303 |
| Decile 8 | 0.11325 |
| Decile 7 | 0.108987 |
| Decile 6 | 0.105514 |
| Median | 0.102207 |
| Decile 4 | 0.0992815 |
| Decile 3 | 0.095943 |
| Decile 2 | 0.0922165 |
| Decile 1 | 0.0876395 |
| Minimum | 0.066396 |
|
|
- Mean = 0.103744
- Std.dev = 0.0171733
- 30 items above graph maximum of 0.152966
|
Notes
Mean OD (orientation dispersion index) in medial lemniscus (right) on FA (fractional anisotropy) skeleton (from dMRI data)
0 Related Data-Fields
There are no related data-fields
2 Applications
| Application ID | Title |
|---|
| 17689 | Genetic, environmental and lifestyle predictors of brain/cognitive-related outcomes. |
| 22783 | The joint analysis of imaging data and genetic data for early tumor detection, prevention, diagnosis and treatment |

