Data
83,906 items of data are available, covering 79,379 participants.
Defined-instances run from 2 to 3, labelled using Instancing
2.
Units of measurement are AU.
| Maximum | 0.99 |
| Decile 9 | 0.656362 |
| Decile 8 | 0.64043 |
| Decile 7 | 0.628773 |
| Decile 6 | 0.618642 |
| Median | 0.608941 |
| Decile 4 | 0.599098 |
| Decile 3 | 0.588553 |
| Decile 2 | 0.576142 |
| Decile 1 | 0.558307 |
| Minimum | 0.343801 |
|
|
- Mean = 0.608081
- Std.dev = 0.0392443
- 42 items below graph minimum of 0.460251
- 41 items above graph maximum of 0.754417
|
2 Instances
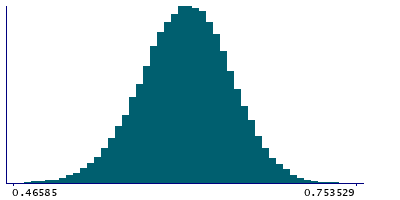
Instance 2 : Imaging visit (2014+)
79,148 participants, 79,148 items
| Maximum | 0.99 |
| Decile 9 | 0.656141 |
| Decile 8 | 0.640082 |
| Decile 7 | 0.628441 |
| Decile 6 | 0.618304 |
| Median | 0.60858 |
| Decile 4 | 0.598701 |
| Decile 3 | 0.58819 |
| Decile 2 | 0.57578 |
| Decile 1 | 0.557878 |
| Minimum | 0.343801 |
|

|
- Mean = 0.607742
- Std.dev = 0.039295
- 42 items below graph minimum of 0.459615
- 38 items above graph maximum of 0.754404
|
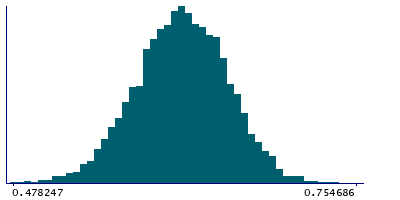
Instance 3 : First repeat imaging visit (2019+)
4,758 participants, 4,758 items
| Maximum | 0.979337 |
| Decile 9 | 0.660277 |
| Decile 8 | 0.644851 |
| Decile 7 | 0.634108 |
| Decile 6 | 0.623576 |
| Median | 0.614181 |
| Decile 4 | 0.605005 |
| Decile 3 | 0.594683 |
| Decile 2 | 0.583282 |
| Decile 1 | 0.565818 |
| Minimum | 0.478247 |
|
|
- Mean = 0.61372
- Std.dev = 0.0379508
- 3 items above graph maximum of 0.754736
|
Notes
Mean ICVF (intra-cellular volume fraction) in cingulum cingulate gyrus (left) on FA (fractional anisotropy) skeleton (from dMRI data)
0 Related Data-Fields
There are no related data-fields
2 Applications
| Application ID | Title |
|---|
| 17689 | Genetic, environmental and lifestyle predictors of brain/cognitive-related outcomes. |
| 22783 | The joint analysis of imaging data and genetic data for early tumor detection, prevention, diagnosis and treatment |

