Data
83,906 items of data are available, covering 79,379 participants.
Defined-instances run from 2 to 3, labelled using Instancing
2.
Units of measurement are AU.
| Maximum | 0.99 |
| Decile 9 | 0.5816 |
| Decile 8 | 0.563855 |
| Decile 7 | 0.551136 |
| Decile 6 | 0.539928 |
| Median | 0.529516 |
| Decile 4 | 0.518868 |
| Decile 3 | 0.507222 |
| Decile 2 | 0.493125 |
| Decile 1 | 0.472934 |
| Minimum | 0 |
|

|
- Mean = 0.528102
- Std.dev = 0.0438294
- 83 items below graph minimum of 0.364267
- 34 items above graph maximum of 0.690267
|
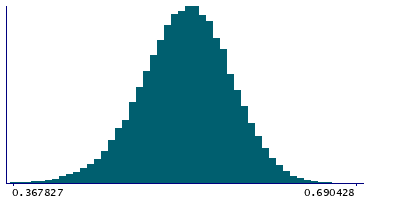
2 Instances
Instance 2 : Imaging visit (2014+)
79,148 participants, 79,148 items
| Maximum | 0.99 |
| Decile 9 | 0.581381 |
| Decile 8 | 0.563601 |
| Decile 7 | 0.550907 |
| Decile 6 | 0.539629 |
| Median | 0.529218 |
| Decile 4 | 0.518507 |
| Decile 3 | 0.506811 |
| Decile 2 | 0.492684 |
| Decile 1 | 0.472486 |
| Minimum | 0 |
|
|
- Mean = 0.527753
- Std.dev = 0.0439031
- 82 items below graph minimum of 0.363591
- 31 items above graph maximum of 0.690277
|
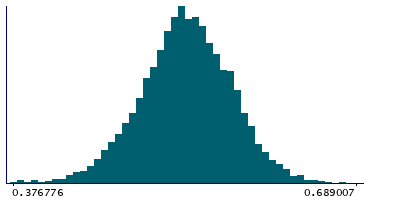
Instance 3 : First repeat imaging visit (2019+)
4,758 participants, 4,758 items
| Maximum | 0.9545 |
| Decile 9 | 0.584939 |
| Decile 8 | 0.568489 |
| Decile 7 | 0.555424 |
| Decile 6 | 0.544496 |
| Median | 0.534389 |
| Decile 4 | 0.524775 |
| Decile 3 | 0.513947 |
| Decile 2 | 0.500396 |
| Decile 1 | 0.480853 |
| Minimum | 0.371493 |
|
|
- Mean = 0.533893
- Std.dev = 0.042165
- 2 items below graph minimum of 0.376767
- 3 items above graph maximum of 0.689025
|
Notes
Mean ICVF (intra-cellular volume fraction) in sagittal stratum (right) on FA (fractional anisotropy) skeleton (from dMRI data)
0 Related Data-Fields
There are no related data-fields
2 Applications
| Application ID | Title |
|---|
| 17689 | Genetic, environmental and lifestyle predictors of brain/cognitive-related outcomes. |
| 22783 | The joint analysis of imaging data and genetic data for early tumor detection, prevention, diagnosis and treatment |

