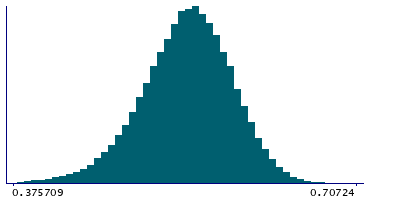
Data
83,906 items of data are available, covering 79,379 participants.
Defined-instances run from 2 to 3, labelled using Instancing
2.
Units of measurement are AU.
| Maximum | 0.99 |
| Decile 9 | 0.595998 |
| Decile 8 | 0.578661 |
| Decile 7 | 0.565897 |
| Decile 6 | 0.554609 |
| Median | 0.543879 |
| Decile 4 | 0.532988 |
| Decile 3 | 0.520645 |
| Decile 2 | 0.505599 |
| Decile 1 | 0.483479 |
| Minimum | 0 |
|
|
- Mean = 0.541275
- Std.dev = 0.0456913
- 142 items below graph minimum of 0.370959
- 34 items above graph maximum of 0.708518
|
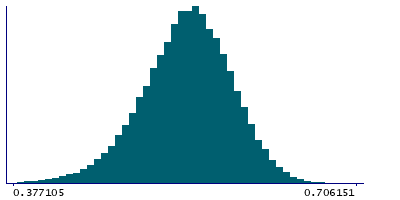
2 Instances
Instance 2 : Imaging visit (2014+)
79,148 participants, 79,148 items
| Maximum | 0.99 |
| Decile 9 | 0.5958 |
| Decile 8 | 0.578396 |
| Decile 7 | 0.565634 |
| Decile 6 | 0.55437 |
| Median | 0.54357 |
| Decile 4 | 0.532671 |
| Decile 3 | 0.520288 |
| Decile 2 | 0.505173 |
| Decile 1 | 0.482908 |
| Minimum | 0 |
|
|
- Mean = 0.54094
- Std.dev = 0.0458395
- 136 items below graph minimum of 0.370016
- 31 items above graph maximum of 0.708691
|
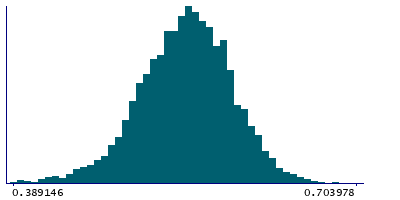
Instance 3 : First repeat imaging visit (2019+)
4,758 participants, 4,758 items
| Maximum | 0.842131 |
| Decile 9 | 0.599042 |
| Decile 8 | 0.581998 |
| Decile 7 | 0.569513 |
| Decile 6 | 0.558869 |
| Median | 0.548785 |
| Decile 4 | 0.538355 |
| Decile 3 | 0.526706 |
| Decile 2 | 0.512857 |
| Decile 1 | 0.494078 |
| Minimum | 0.356144 |
|
|
- Mean = 0.546853
- Std.dev = 0.0427681
- 5 items below graph minimum of 0.389115
- 3 items above graph maximum of 0.704006
|
Notes
Mean ICVF (intra-cellular volume fraction) in posterior thalamic radiation (right) on FA (fractional anisotropy) skeleton (from dMRI data)
0 Related Data-Fields
There are no related data-fields
2 Applications
| Application ID | Title |
|---|
| 17689 | Genetic, environmental and lifestyle predictors of brain/cognitive-related outcomes. |
| 22783 | The joint analysis of imaging data and genetic data for early tumor detection, prevention, diagnosis and treatment |

