Data
83,906 items of data are available, covering 79,379 participants.
Defined-instances run from 2 to 3, labelled using Instancing
2.
Units of measurement are AU.
| Maximum | 0.989979 |
| Decile 9 | 0.725467 |
| Decile 8 | 0.715912 |
| Decile 7 | 0.70908 |
| Decile 6 | 0.703274 |
| Median | 0.697775 |
| Decile 4 | 0.692214 |
| Decile 3 | 0.686224 |
| Decile 2 | 0.678955 |
| Decile 1 | 0.668624 |
| Minimum | 0 |
|

|
- Mean = 0.697356
- Std.dev = 0.0236558
- 79 items below graph minimum of 0.611781
- 64 items above graph maximum of 0.78231
|
2 Instances
Instance 2 : Imaging visit (2014+)
79,148 participants, 79,148 items
| Maximum | 0.989979 |
| Decile 9 | 0.725418 |
| Decile 8 | 0.715834 |
| Decile 7 | 0.708994 |
| Decile 6 | 0.703183 |
| Median | 0.697671 |
| Decile 4 | 0.692083 |
| Decile 3 | 0.686113 |
| Decile 2 | 0.678863 |
| Decile 1 | 0.668556 |
| Minimum | 0 |
|

|
- Mean = 0.697255
- Std.dev = 0.0236733
- 74 items below graph minimum of 0.611694
- 59 items above graph maximum of 0.782281
|
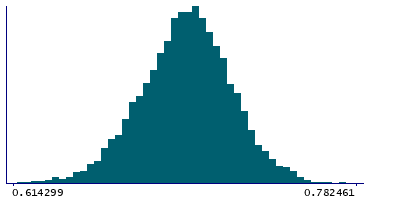
Instance 3 : First repeat imaging visit (2019+)
4,758 participants, 4,758 items
| Maximum | 0.968633 |
| Decile 9 | 0.726399 |
| Decile 8 | 0.716958 |
| Decile 7 | 0.71049 |
| Decile 6 | 0.704814 |
| Median | 0.699717 |
| Decile 4 | 0.694274 |
| Decile 3 | 0.688162 |
| Decile 2 | 0.680648 |
| Decile 1 | 0.670341 |
| Minimum | 0.518586 |
|
|
- Mean = 0.699033
- Std.dev = 0.0232996
- 5 items below graph minimum of 0.614282
- 5 items above graph maximum of 0.782458
|
Notes
Mean ICVF (intra-cellular volume fraction) in superior cerebellar peduncle (left) on FA (fractional anisotropy) skeleton (from dMRI data)
0 Related Data-Fields
There are no related data-fields
2 Applications
| Application ID | Title |
|---|
| 17689 | Genetic, environmental and lifestyle predictors of brain/cognitive-related outcomes. |
| 22783 | The joint analysis of imaging data and genetic data for early tumor detection, prevention, diagnosis and treatment |

