Data
83,906 items of data are available, covering 79,379 participants.
Defined-instances run from 2 to 3, labelled using Instancing
2.
Units of measurement are AU.
| Maximum | 0.99 |
| Decile 9 | 0.72595 |
| Decile 8 | 0.716182 |
| Decile 7 | 0.709181 |
| Decile 6 | 0.703168 |
| Median | 0.697548 |
| Decile 4 | 0.691923 |
| Decile 3 | 0.68572 |
| Decile 2 | 0.678471 |
| Decile 1 | 0.668291 |
| Minimum | 0 |
|

|
- Mean = 0.697325
- Std.dev = 0.0240027
- 59 items below graph minimum of 0.610631
- 67 items above graph maximum of 0.78361
|
2 Instances
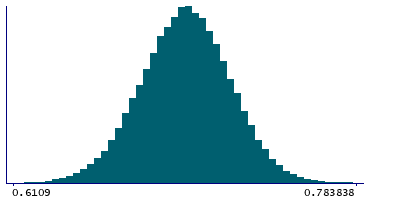
Instance 2 : Imaging visit (2014+)
79,148 participants, 79,148 items
| Maximum | 0.99 |
| Decile 9 | 0.72581 |
| Decile 8 | 0.716061 |
| Decile 7 | 0.709048 |
| Decile 6 | 0.703039 |
| Median | 0.697426 |
| Decile 4 | 0.691789 |
| Decile 3 | 0.685603 |
| Decile 2 | 0.678319 |
| Decile 1 | 0.668123 |
| Minimum | 0 |
|
|
- Mean = 0.697185
- Std.dev = 0.0240067
- 57 items below graph minimum of 0.610436
- 62 items above graph maximum of 0.783497
|
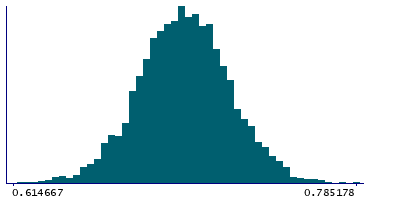
Instance 3 : First repeat imaging visit (2019+)
4,758 participants, 4,758 items
| Maximum | 0.983064 |
| Decile 9 | 0.72834 |
| Decile 8 | 0.718255 |
| Decile 7 | 0.711321 |
| Decile 6 | 0.705334 |
| Median | 0.699556 |
| Decile 4 | 0.693761 |
| Decile 3 | 0.687727 |
| Decile 2 | 0.680797 |
| Decile 1 | 0.671496 |
| Minimum | 0.60222 |
|
|
- Mean = 0.69965
- Std.dev = 0.0238167
- 3 items below graph minimum of 0.614651
- 5 items above graph maximum of 0.785184
|
Notes
Mean ICVF (intra-cellular volume fraction) in superior cerebellar peduncle (right) on FA (fractional anisotropy) skeleton (from dMRI data)
0 Related Data-Fields
There are no related data-fields
2 Applications
| Application ID | Title |
|---|
| 17689 | Genetic, environmental and lifestyle predictors of brain/cognitive-related outcomes. |
| 22783 | The joint analysis of imaging data and genetic data for early tumor detection, prevention, diagnosis and treatment |

