Data
83,906 items of data are available, covering 79,379 participants.
Defined-instances run from 2 to 3, labelled using Instancing
2.
Units of measurement are AU.
| Maximum | 0.99 |
| Decile 9 | 0.707826 |
| Decile 8 | 0.694859 |
| Decile 7 | 0.685822 |
| Decile 6 | 0.67813 |
| Median | 0.671034 |
| Decile 4 | 0.664075 |
| Decile 3 | 0.656476 |
| Decile 2 | 0.64778 |
| Decile 1 | 0.635201 |
| Minimum | 0 |
|
|
- Mean = 0.671415
- Std.dev = 0.0294419
- 35 items below graph minimum of 0.562575
- 62 items above graph maximum of 0.780452
|
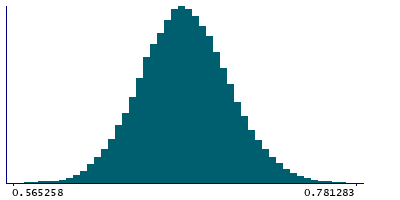
2 Instances
Instance 2 : Imaging visit (2014+)
79,148 participants, 79,148 items
| Maximum | 0.99 |
| Decile 9 | 0.707224 |
| Decile 8 | 0.694282 |
| Decile 7 | 0.685299 |
| Decile 6 | 0.677609 |
| Median | 0.670511 |
| Decile 4 | 0.663571 |
| Decile 3 | 0.65597 |
| Decile 2 | 0.647274 |
| Decile 1 | 0.634691 |
| Minimum | 0 |
|

|
- Mean = 0.67088
- Std.dev = 0.0294069
- 34 items below graph minimum of 0.562158
- 57 items above graph maximum of 0.779758
|
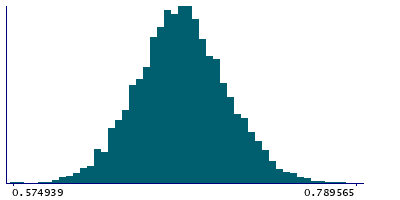
Instance 3 : First repeat imaging visit (2019+)
4,758 participants, 4,758 items
| Maximum | 0.95144 |
| Decile 9 | 0.717137 |
| Decile 8 | 0.703291 |
| Decile 7 | 0.693958 |
| Decile 6 | 0.686419 |
| Median | 0.679817 |
| Decile 4 | 0.672815 |
| Decile 3 | 0.665551 |
| Decile 2 | 0.657065 |
| Decile 1 | 0.644693 |
| Minimum | 0.574939 |
|
|
- Mean = 0.680312
- Std.dev = 0.0285871
- 4 items above graph maximum of 0.789582
|
Notes
Mean ICVF (intra-cellular volume fraction) in inferior cerebellar peduncle (right) on FA (fractional anisotropy) skeleton (from dMRI data)
0 Related Data-Fields
There are no related data-fields
2 Applications
| Application ID | Title |
|---|
| 17689 | Genetic, environmental and lifestyle predictors of brain/cognitive-related outcomes. |
| 22783 | The joint analysis of imaging data and genetic data for early tumor detection, prevention, diagnosis and treatment |

