Data
83,906 items of data are available, covering 79,379 participants.
Defined-instances run from 2 to 3, labelled using Instancing
2.
Units of measurement are AU.
| Maximum | 0.99 |
| Decile 9 | 0.660047 |
| Decile 8 | 0.646374 |
| Decile 7 | 0.636923 |
| Decile 6 | 0.628959 |
| Median | 0.621735 |
| Decile 4 | 0.614535 |
| Decile 3 | 0.606946 |
| Decile 2 | 0.598053 |
| Decile 1 | 0.585307 |
| Minimum | 0 |
|

|
- Mean = 0.622319
- Std.dev = 0.031136
- 74 items below graph minimum of 0.510568
- 113 items above graph maximum of 0.734787
|
2 Instances
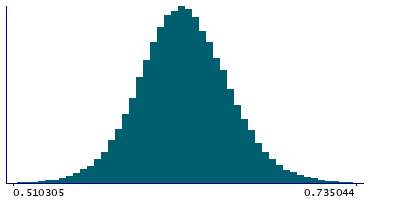
Instance 2 : Imaging visit (2014+)
79,148 participants, 79,148 items
| Maximum | 0.99 |
| Decile 9 | 0.659501 |
| Decile 8 | 0.645967 |
| Decile 7 | 0.63648 |
| Decile 6 | 0.628545 |
| Median | 0.621357 |
| Decile 4 | 0.614138 |
| Decile 3 | 0.606542 |
| Decile 2 | 0.59772 |
| Decile 1 | 0.58494 |
| Minimum | 0 |
|
|
- Mean = 0.621912
- Std.dev = 0.0310861
- 73 items below graph minimum of 0.510379
- 107 items above graph maximum of 0.734063
|
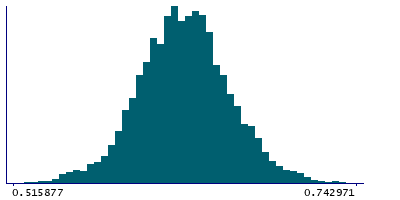
Instance 3 : First repeat imaging visit (2019+)
4,758 participants, 4,758 items
| Maximum | 0.981665 |
| Decile 9 | 0.66725 |
| Decile 8 | 0.653185 |
| Decile 7 | 0.643679 |
| Decile 6 | 0.636209 |
| Median | 0.628702 |
| Decile 4 | 0.621302 |
| Decile 3 | 0.613479 |
| Decile 2 | 0.604498 |
| Decile 1 | 0.591555 |
| Minimum | 0.512385 |
|
|
- Mean = 0.629095
- Std.dev = 0.0311832
- 1 item below graph minimum of 0.51586
- 8 items above graph maximum of 0.742946
|
Notes
Mean ICVF (intra-cellular volume fraction) in medial lemniscus (left) on FA (fractional anisotropy) skeleton (from dMRI data)
0 Related Data-Fields
There are no related data-fields
2 Applications
| Application ID | Title |
|---|
| 17689 | Genetic, environmental and lifestyle predictors of brain/cognitive-related outcomes. |
| 22783 | The joint analysis of imaging data and genetic data for early tumor detection, prevention, diagnosis and treatment |

