Data
83,906 items of data are available, covering 79,379 participants.
Defined-instances run from 2 to 3, labelled using Instancing
2.
Units of measurement are AU.
| Maximum | 0.99 |
| Decile 9 | 0.65528 |
| Decile 8 | 0.642712 |
| Decile 7 | 0.633692 |
| Decile 6 | 0.626188 |
| Median | 0.619261 |
| Decile 4 | 0.612218 |
| Decile 3 | 0.604724 |
| Decile 2 | 0.595961 |
| Decile 1 | 0.583407 |
| Minimum | 0 |
|
|
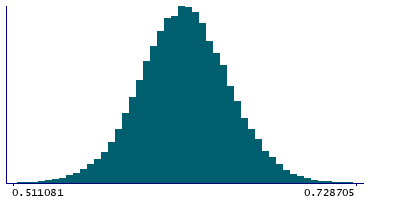
- Mean = 0.619297
- Std.dev = 0.0299932
- 85 items below graph minimum of 0.511535
- 94 items above graph maximum of 0.727152
|
2 Instances
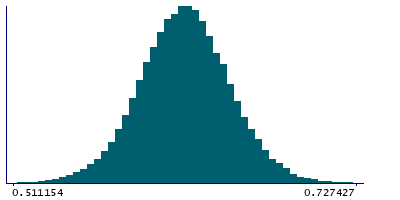
Instance 2 : Imaging visit (2014+)
79,148 participants, 79,148 items
| Maximum | 0.99 |
| Decile 9 | 0.654775 |
| Decile 8 | 0.64222 |
| Decile 7 | 0.63328 |
| Decile 6 | 0.625843 |
| Median | 0.618909 |
| Decile 4 | 0.611908 |
| Decile 3 | 0.604418 |
| Decile 2 | 0.59563 |
| Decile 1 | 0.583148 |
| Minimum | 0 |
|
|
- Mean = 0.618929
- Std.dev = 0.0299384
- 84 items below graph minimum of 0.511521
- 93 items above graph maximum of 0.726403
|
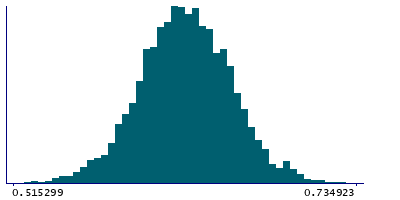
Instance 3 : First repeat imaging visit (2019+)
4,758 participants, 4,758 items
| Maximum | 0.988143 |
| Decile 9 | 0.661744 |
| Decile 8 | 0.650047 |
| Decile 7 | 0.640653 |
| Decile 6 | 0.632663 |
| Median | 0.625135 |
| Decile 4 | 0.618013 |
| Decile 3 | 0.610131 |
| Decile 2 | 0.601284 |
| Decile 1 | 0.588485 |
| Minimum | 0.504876 |
|
|
- Mean = 0.625411
- Std.dev = 0.0302419
- 2 items below graph minimum of 0.515225
- 4 items above graph maximum of 0.735003
|
Notes
Mean ICVF (intra-cellular volume fraction) in medial lemniscus (right) on FA (fractional anisotropy) skeleton (from dMRI data)
0 Related Data-Fields
There are no related data-fields
2 Applications
| Application ID | Title |
|---|
| 17689 | Genetic, environmental and lifestyle predictors of brain/cognitive-related outcomes. |
| 22783 | The joint analysis of imaging data and genetic data for early tumor detection, prevention, diagnosis and treatment |

