Data
83,906 items of data are available, covering 79,379 participants.
Defined-instances run from 2 to 3, labelled using Instancing
2.
Units of measurement are AU.
| Maximum | 0.99 |
| Decile 9 | 0.630381 |
| Decile 8 | 0.605874 |
| Decile 7 | 0.587227 |
| Decile 6 | 0.570376 |
| Median | 0.553864 |
| Decile 4 | 0.535947 |
| Decile 3 | 0.514779 |
| Decile 2 | 0.487808 |
| Decile 1 | 0.448526 |
| Minimum | 0 |
|

|
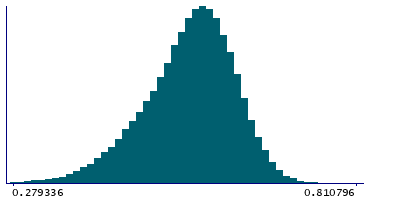
- Mean = 0.545702
- Std.dev = 0.0728877
- 127 items below graph minimum of 0.266671
- 31 items above graph maximum of 0.812235
|
2 Instances
Instance 2 : Imaging visit (2014+)
79,148 participants, 79,148 items
| Maximum | 0.99 |
| Decile 9 | 0.630242 |
| Decile 8 | 0.605784 |
| Decile 7 | 0.586979 |
| Decile 6 | 0.570084 |
| Median | 0.553537 |
| Decile 4 | 0.535503 |
| Decile 3 | 0.514223 |
| Decile 2 | 0.487249 |
| Decile 1 | 0.447793 |
| Minimum | 0 |
|
|
- Mean = 0.545295
- Std.dev = 0.0731093
- 120 items below graph minimum of 0.265344
- 29 items above graph maximum of 0.81269
|
Instance 3 : First repeat imaging visit (2019+)
4,758 participants, 4,758 items
| Maximum | 0.99 |
| Decile 9 | 0.632831 |
| Decile 8 | 0.608769 |
| Decile 7 | 0.59136 |
| Decile 6 | 0.575118 |
| Median | 0.558888 |
| Decile 4 | 0.54256 |
| Decile 3 | 0.523741 |
| Decile 2 | 0.498984 |
| Decile 1 | 0.463402 |
| Minimum | 0.137649 |
|

|
- Mean = 0.552489
- Std.dev = 0.0687443
- 7 items below graph minimum of 0.293972
- 2 items above graph maximum of 0.802261
|
Notes
Mean ICVF (intra-cellular volume fraction) in fornix on FA (fractional anisotropy) skeleton (from dMRI data)
0 Related Data-Fields
There are no related data-fields
2 Applications
| Application ID | Title |
|---|
| 17689 | Genetic, environmental and lifestyle predictors of brain/cognitive-related outcomes. |
| 22783 | The joint analysis of imaging data and genetic data for early tumor detection, prevention, diagnosis and treatment |

