Data
83,906 items of data are available, covering 79,379 participants.
Defined-instances run from 2 to 3, labelled using Instancing
2.
Units of measurement are AU.
| Maximum | 0.99 |
| Decile 9 | 0.6665 |
| Decile 8 | 0.649622 |
| Decile 7 | 0.636977 |
| Decile 6 | 0.626219 |
| Median | 0.615782 |
| Decile 4 | 0.605182 |
| Decile 3 | 0.593449 |
| Decile 2 | 0.579355 |
| Decile 1 | 0.559772 |
| Minimum | 0.327043 |
|
|
- Mean = 0.614178
- Std.dev = 0.0427814
- 54 items below graph minimum of 0.453043
- 43 items above graph maximum of 0.773229
|
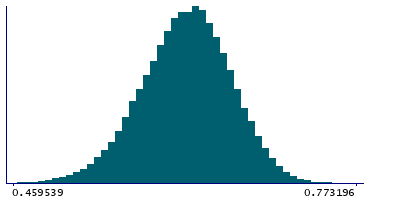
2 Instances
Instance 2 : Imaging visit (2014+)
79,148 participants, 79,148 items
| Maximum | 0.99 |
| Decile 9 | 0.666239 |
| Decile 8 | 0.649308 |
| Decile 7 | 0.636697 |
| Decile 6 | 0.625941 |
| Median | 0.615446 |
| Decile 4 | 0.60477 |
| Decile 3 | 0.593037 |
| Decile 2 | 0.578934 |
| Decile 1 | 0.559278 |
| Minimum | 0.327043 |
|

|
- Mean = 0.613831
- Std.dev = 0.0428866
- 52 items below graph minimum of 0.452316
- 40 items above graph maximum of 0.7732
|
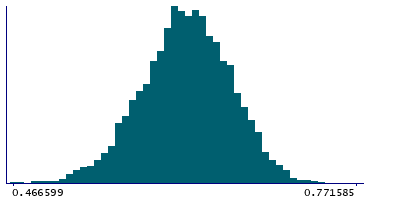
Instance 3 : First repeat imaging visit (2019+)
4,758 participants, 4,758 items
| Maximum | 0.987644 |
| Decile 9 | 0.669933 |
| Decile 8 | 0.654016 |
| Decile 7 | 0.641376 |
| Decile 6 | 0.630688 |
| Median | 0.620874 |
| Decile 4 | 0.611035 |
| Decile 3 | 0.600538 |
| Decile 2 | 0.587255 |
| Decile 1 | 0.568245 |
| Minimum | 0.45218 |
|
|
- Mean = 0.619963
- Std.dev = 0.0405569
- 2 items below graph minimum of 0.466556
- 3 items above graph maximum of 0.771622
|
Notes
Mean ICVF (intra-cellular volume fraction) in genu of corpus callosum on FA (fractional anisotropy) skeleton (from dMRI data)
0 Related Data-Fields
There are no related data-fields
2 Applications
| Application ID | Title |
|---|
| 17689 | Genetic, environmental and lifestyle predictors of brain/cognitive-related outcomes. |
| 22783 | The joint analysis of imaging data and genetic data for early tumor detection, prevention, diagnosis and treatment |

