Data
83,906 items of data are available, covering 79,379 participants.
Defined-instances run from 2 to 3, labelled using Instancing
2.
Units of measurement are AU.
| Maximum | 0.989987 |
| Decile 9 | 0.784501 |
| Decile 8 | 0.773787 |
| Decile 7 | 0.765775 |
| Decile 6 | 0.758933 |
| Median | 0.752485 |
| Decile 4 | 0.745791 |
| Decile 3 | 0.738658 |
| Decile 2 | 0.730101 |
| Decile 1 | 0.71783 |
| Minimum | 0 |
|
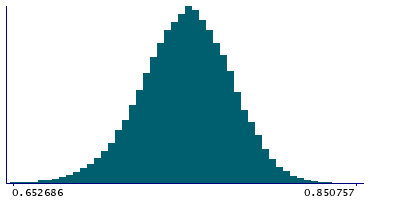
|
- Mean = 0.751628
- Std.dev = 0.0271166
- 75 items below graph minimum of 0.651158
- 36 items above graph maximum of 0.851173
|
2 Instances
Instance 2 : Imaging visit (2014+)
79,148 participants, 79,148 items
| Maximum | 0.989987 |
| Decile 9 | 0.784246 |
| Decile 8 | 0.773477 |
| Decile 7 | 0.765437 |
| Decile 6 | 0.758611 |
| Median | 0.75218 |
| Decile 4 | 0.745442 |
| Decile 3 | 0.738349 |
| Decile 2 | 0.729763 |
| Decile 1 | 0.717535 |
| Minimum | 0 |
|
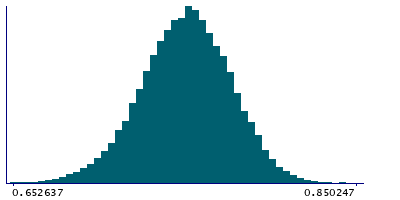
|
- Mean = 0.751303
- Std.dev = 0.0271633
- 72 items below graph minimum of 0.650824
- 32 items above graph maximum of 0.850957
|
Instance 3 : First repeat imaging visit (2019+)
4,758 participants, 4,758 items
| Maximum | 0.879854 |
| Decile 9 | 0.7883 |
| Decile 8 | 0.778365 |
| Decile 7 | 0.770784 |
| Decile 6 | 0.764196 |
| Median | 0.757794 |
| Decile 4 | 0.751489 |
| Decile 3 | 0.744546 |
| Decile 2 | 0.736138 |
| Decile 1 | 0.723358 |
| Minimum | 0.643596 |
|
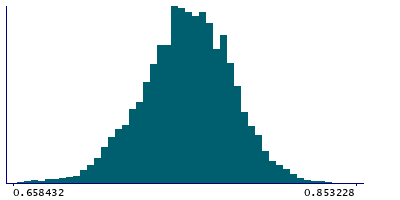
|
- Mean = 0.757021
- Std.dev = 0.0257343
- 1 item below graph minimum of 0.658416
- 4 items above graph maximum of 0.853242
|
Notes
Mean ICVF (intra-cellular volume fraction) in middle cerebellar peduncle on FA (fractional anisotropy) skeleton (from dMRI data)
0 Related Data-Fields
There are no related data-fields
2 Applications
| Application ID | Title |
|---|
| 17689 | Genetic, environmental and lifestyle predictors of brain/cognitive-related outcomes. |
| 22783 | The joint analysis of imaging data and genetic data for early tumor detection, prevention, diagnosis and treatment |

