Data
83,911 items of data are available, covering 79,384 participants.
Defined-instances run from 2 to 3, labelled using Instancing
2.
Units of measurement are AU.
| Maximum | 0.002964 |
| Decile 9 | 0.000831 |
| Decile 8 | 0.00073 |
| Decile 7 | 0.000673 |
| Decile 6 | 0.000629 |
| Median | 0.000593 |
| Decile 4 | 0.000561 |
| Decile 3 | 0.000528 |
| Decile 2 | 0.000492 |
| Decile 1 | 0.000448 |
| Minimum | 0 |
|
|
- Mean = 0.000621697
- Std.dev = 0.000162474
- 488 items above graph maximum of 0.001214
|
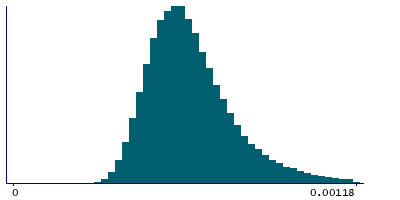
2 Instances
Instance 2 : Imaging visit (2014+)
79,153 participants, 79,153 items
| Maximum | 0.002964 |
| Decile 9 | 0.0008325 |
| Decile 8 | 0.000732 |
| Decile 7 | 0.000674 |
| Decile 6 | 0.00063 |
| Median | 0.000594 |
| Decile 4 | 0.000562 |
| Decile 3 | 0.000528 |
| Decile 2 | 0.000493 |
| Decile 1 | 0.000449 |
| Minimum | 0 |
|

|
- Mean = 0.000622897
- Std.dev = 0.000162965
- 462 items above graph maximum of 0.001216
|
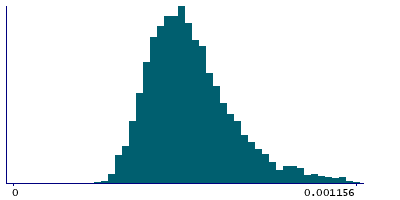
Instance 3 : First repeat imaging visit (2019+)
4,758 participants, 4,758 items
| Maximum | 0.001585 |
| Decile 9 | 0.000796 |
| Decile 8 | 0.0007065 |
| Decile 7 | 0.000651 |
| Decile 6 | 0.0006125 |
| Median | 0.000577 |
| Decile 4 | 0.000546 |
| Decile 3 | 0.000513 |
| Decile 2 | 0.000478 |
| Decile 1 | 0.000436 |
| Minimum | 0.000191 |
|
|
- Mean = 0.000601744
- Std.dev = 0.000152701
- 26 items above graph maximum of 0.001156
|
Notes
Mean L3 in tapetum (right) on FA (fractional anisotropy) skeleton (from dMRI data)
0 Related Data-Fields
There are no related data-fields
2 Applications
| Application ID | Title |
|---|
| 17689 | Genetic, environmental and lifestyle predictors of brain/cognitive-related outcomes. |
| 22783 | The joint analysis of imaging data and genetic data for early tumor detection, prevention, diagnosis and treatment |

