Data
83,911 items of data are available, covering 79,384 participants.
Defined-instances run from 2 to 3, labelled using Instancing
2.
Units of measurement are AU.
| Maximum | 0.001823 |
| Decile 9 | 0.000497 |
| Decile 8 | 0.000466 |
| Decile 7 | 0.000446 |
| Decile 6 | 0.000431 |
| Median | 0.000418 |
| Decile 4 | 0.000406 |
| Decile 3 | 0.000394 |
| Decile 2 | 0.000381 |
| Decile 1 | 0.000364 |
| Minimum | 0 |
|

|
- Mean = 0.000426646
- Std.dev = 5.8778e-05
- 4 items below graph minimum of 0.000231
- 670 items above graph maximum of 0.00063
|
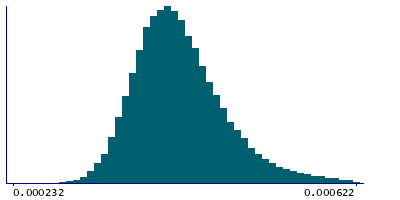
2 Instances
Instance 2 : Imaging visit (2014+)
79,153 participants, 79,153 items
| Maximum | 0.001823 |
| Decile 9 | 0.000498 |
| Decile 8 | 0.000467 |
| Decile 7 | 0.000447 |
| Decile 6 | 0.000432 |
| Median | 0.000419 |
| Decile 4 | 0.000407 |
| Decile 3 | 0.000395 |
| Decile 2 | 0.000381 |
| Decile 1 | 0.000364 |
| Minimum | 0 |
|
|
- Mean = 0.00042737
- Std.dev = 5.90963e-05
- 3 items below graph minimum of 0.00023
- 624 items above graph maximum of 0.000632
|
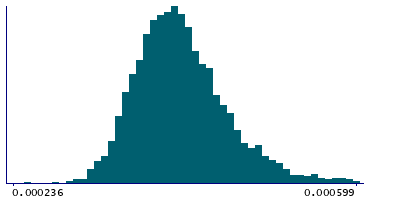
Instance 3 : First repeat imaging visit (2019+)
4,758 participants, 4,758 items
| Maximum | 0.00077 |
| Decile 9 | 0.0004785 |
| Decile 8 | 0.00045 |
| Decile 7 | 0.000433 |
| Decile 6 | 0.00042 |
| Median | 0.000409 |
| Decile 4 | 0.000397 |
| Decile 3 | 0.000386 |
| Decile 2 | 0.000374 |
| Decile 1 | 0.000357 |
| Minimum | 9.1e-05 |
|
|
- Mean = 0.000414604
- Std.dev = 5.174e-05
- 1 item below graph minimum of 0.0002355
- 25 items above graph maximum of 0.0006
|
Notes
Mean L3 in posterior thalamic radiation (right) on FA (fractional anisotropy) skeleton (from dMRI data)
0 Related Data-Fields
There are no related data-fields
2 Applications
| Application ID | Title |
|---|
| 17689 | Genetic, environmental and lifestyle predictors of brain/cognitive-related outcomes. |
| 22783 | The joint analysis of imaging data and genetic data for early tumor detection, prevention, diagnosis and treatment |

