Data
83,911 items of data are available, covering 79,384 participants.
Defined-instances run from 2 to 3, labelled using Instancing
2.
Units of measurement are AU.
| Maximum | 0.003107 |
| Decile 9 | 0.000909 |
| Decile 8 | 0.000821 |
| Decile 7 | 0.00077 |
| Decile 6 | 0.000732 |
| Median | 0.000699 |
| Decile 4 | 0.000668 |
| Decile 3 | 0.000638 |
| Decile 2 | 0.0006045 |
| Decile 1 | 0.000562 |
| Minimum | 0 |
|

|
- Mean = 0.000722031
- Std.dev = 0.000150346
- 601 items above graph maximum of 0.001256
|
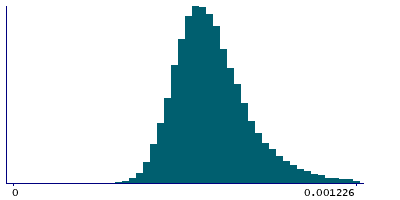
2 Instances
Instance 2 : Imaging visit (2014+)
79,153 participants, 79,153 items
| Maximum | 0.003107 |
| Decile 9 | 0.000911 |
| Decile 8 | 0.000823 |
| Decile 7 | 0.000772 |
| Decile 6 | 0.000733 |
| Median | 0.0007 |
| Decile 4 | 0.000669 |
| Decile 3 | 0.000638 |
| Decile 2 | 0.000605 |
| Decile 1 | 0.000562 |
| Minimum | 0 |
|
|
- Mean = 0.00072315
- Std.dev = 0.000151092
- 569 items above graph maximum of 0.00126
|
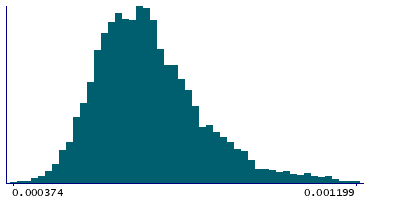
Instance 3 : First repeat imaging visit (2019+)
4,758 participants, 4,758 items
| Maximum | 0.001677 |
| Decile 9 | 0.000877 |
| Decile 8 | 0.000797 |
| Decile 7 | 0.000751 |
| Decile 6 | 0.000712 |
| Median | 0.000684 |
| Decile 4 | 0.000655 |
| Decile 3 | 0.000625 |
| Decile 2 | 0.000594 |
| Decile 1 | 0.000555 |
| Minimum | 0.000374 |
|
|
- Mean = 0.000703428
- Std.dev = 0.000135992
- 25 items above graph maximum of 0.001199
|
Notes
Mean L2 in tapetum (left) on FA (fractional anisotropy) skeleton (from dMRI data)
0 Related Data-Fields
There are no related data-fields
2 Applications
| Application ID | Title |
|---|
| 17689 | Genetic, environmental and lifestyle predictors of brain/cognitive-related outcomes. |
| 22783 | The joint analysis of imaging data and genetic data for early tumor detection, prevention, diagnosis and treatment |

