Data
83,911 items of data are available, covering 79,384 participants.
Defined-instances run from 2 to 3, labelled using Instancing
2.
Units of measurement are AU.
| Maximum | 0.002256 |
| Decile 9 | 0.000689 |
| Decile 8 | 0.00067 |
| Decile 7 | 0.000657 |
| Decile 6 | 0.000646 |
| Median | 0.000636 |
| Decile 4 | 0.000626 |
| Decile 3 | 0.000616 |
| Decile 2 | 0.000604 |
| Decile 1 | 0.000588 |
| Minimum | 0 |
|

|
- Mean = 0.000637835
- Std.dev = 4.30606e-05
- 8 items below graph minimum of 0.000487
- 202 items above graph maximum of 0.00079
|
2 Instances
Instance 2 : Imaging visit (2014+)
79,153 participants, 79,153 items
| Maximum | 0.002256 |
| Decile 9 | 0.000689 |
| Decile 8 | 0.000671 |
| Decile 7 | 0.000657 |
| Decile 6 | 0.000647 |
| Median | 0.000637 |
| Decile 4 | 0.000627 |
| Decile 3 | 0.000616 |
| Decile 2 | 0.000605 |
| Decile 1 | 0.000588 |
| Minimum | 0 |
|

|
- Mean = 0.000638359
- Std.dev = 4.29788e-05
- 8 items below graph minimum of 0.000487
- 194 items above graph maximum of 0.00079
|
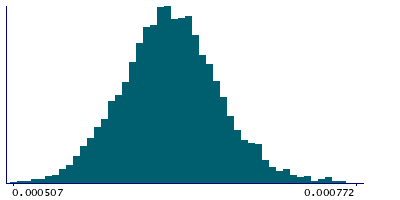
Instance 3 : First repeat imaging visit (2019+)
4,758 participants, 4,758 items
| Maximum | 0.001978 |
| Decile 9 | 0.0006765 |
| Decile 8 | 0.000659 |
| Decile 7 | 0.000647 |
| Decile 6 | 0.000638 |
| Median | 0.000628 |
| Decile 4 | 0.000619 |
| Decile 3 | 0.000609 |
| Decile 2 | 0.000597 |
| Decile 1 | 0.0005805 |
| Minimum | 0.000507 |
|
|
- Mean = 0.000629115
- Std.dev = 4.3482e-05
- 11 items above graph maximum of 0.0007725
|
Notes
Mean L2 in cingulum hippocampus (right) on FA (fractional anisotropy) skeleton (from dMRI data)
0 Related Data-Fields
There are no related data-fields
2 Applications
| Application ID | Title |
|---|
| 17689 | Genetic, environmental and lifestyle predictors of brain/cognitive-related outcomes. |
| 22783 | The joint analysis of imaging data and genetic data for early tumor detection, prevention, diagnosis and treatment |

