Data
83,911 items of data are available, covering 79,384 participants.
Defined-instances run from 2 to 3, labelled using Instancing
2.
Units of measurement are AU.
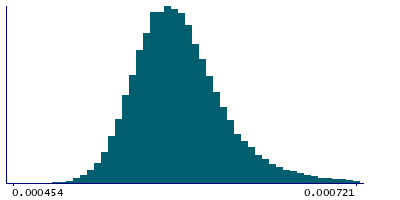
| Maximum | 0.001965 |
| Decile 9 | 0.000636 |
| Decile 8 | 0.000614 |
| Decile 7 | 0.000601 |
| Decile 6 | 0.000592 |
| Median | 0.000583 |
| Decile 4 | 0.000575 |
| Decile 3 | 0.000566 |
| Decile 2 | 0.000557 |
| Decile 1 | 0.000545 |
| Minimum | 0 |
|
|
- Mean = 0.00058828
- Std.dev = 4.19685e-05
- 3 items below graph minimum of 0.000454
- 875 items above graph maximum of 0.000727
|
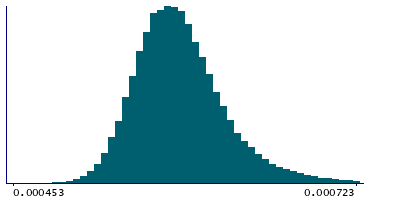
2 Instances
Instance 2 : Imaging visit (2014+)
79,153 participants, 79,153 items
| Maximum | 0.001965 |
| Decile 9 | 0.000636 |
| Decile 8 | 0.000615 |
| Decile 7 | 0.000602 |
| Decile 6 | 0.000592 |
| Median | 0.000584 |
| Decile 4 | 0.000575 |
| Decile 3 | 0.000567 |
| Decile 2 | 0.000558 |
| Decile 1 | 0.000545 |
| Minimum | 0 |
|
|
- Mean = 0.000588947
- Std.dev = 4.20547e-05
- 3 items below graph minimum of 0.000454
- 834 items above graph maximum of 0.000727
|
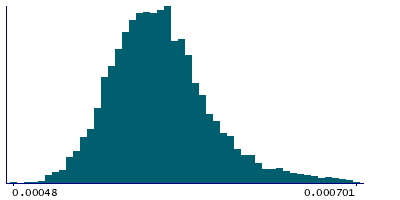
Instance 3 : First repeat imaging visit (2019+)
4,758 participants, 4,758 items
| Maximum | 0.000888 |
| Decile 9 | 0.0006195 |
| Decile 8 | 0.0006 |
| Decile 7 | 0.000589 |
| Decile 6 | 0.00058 |
| Median | 0.000572 |
| Decile 4 | 0.000565 |
| Decile 3 | 0.000557 |
| Decile 2 | 0.000548 |
| Decile 1 | 0.000537 |
| Minimum | 0.00048 |
|
|
- Mean = 0.000577182
- Std.dev = 3.8863e-05
- 64 items above graph maximum of 0.000702
|
Notes
Mean L2 in inferior cerebellar peduncle (right) on FA (fractional anisotropy) skeleton (from dMRI data)
0 Related Data-Fields
There are no related data-fields
2 Applications
| Application ID | Title |
|---|
| 17689 | Genetic, environmental and lifestyle predictors of brain/cognitive-related outcomes. |
| 22783 | The joint analysis of imaging data and genetic data for early tumor detection, prevention, diagnosis and treatment |

